

Health overview
The Health page gives you a high-level view of your Fingerprint setup, surfacing issues that need attention and pointing you to where to fix them. To check it out, visit Dashboard > Health.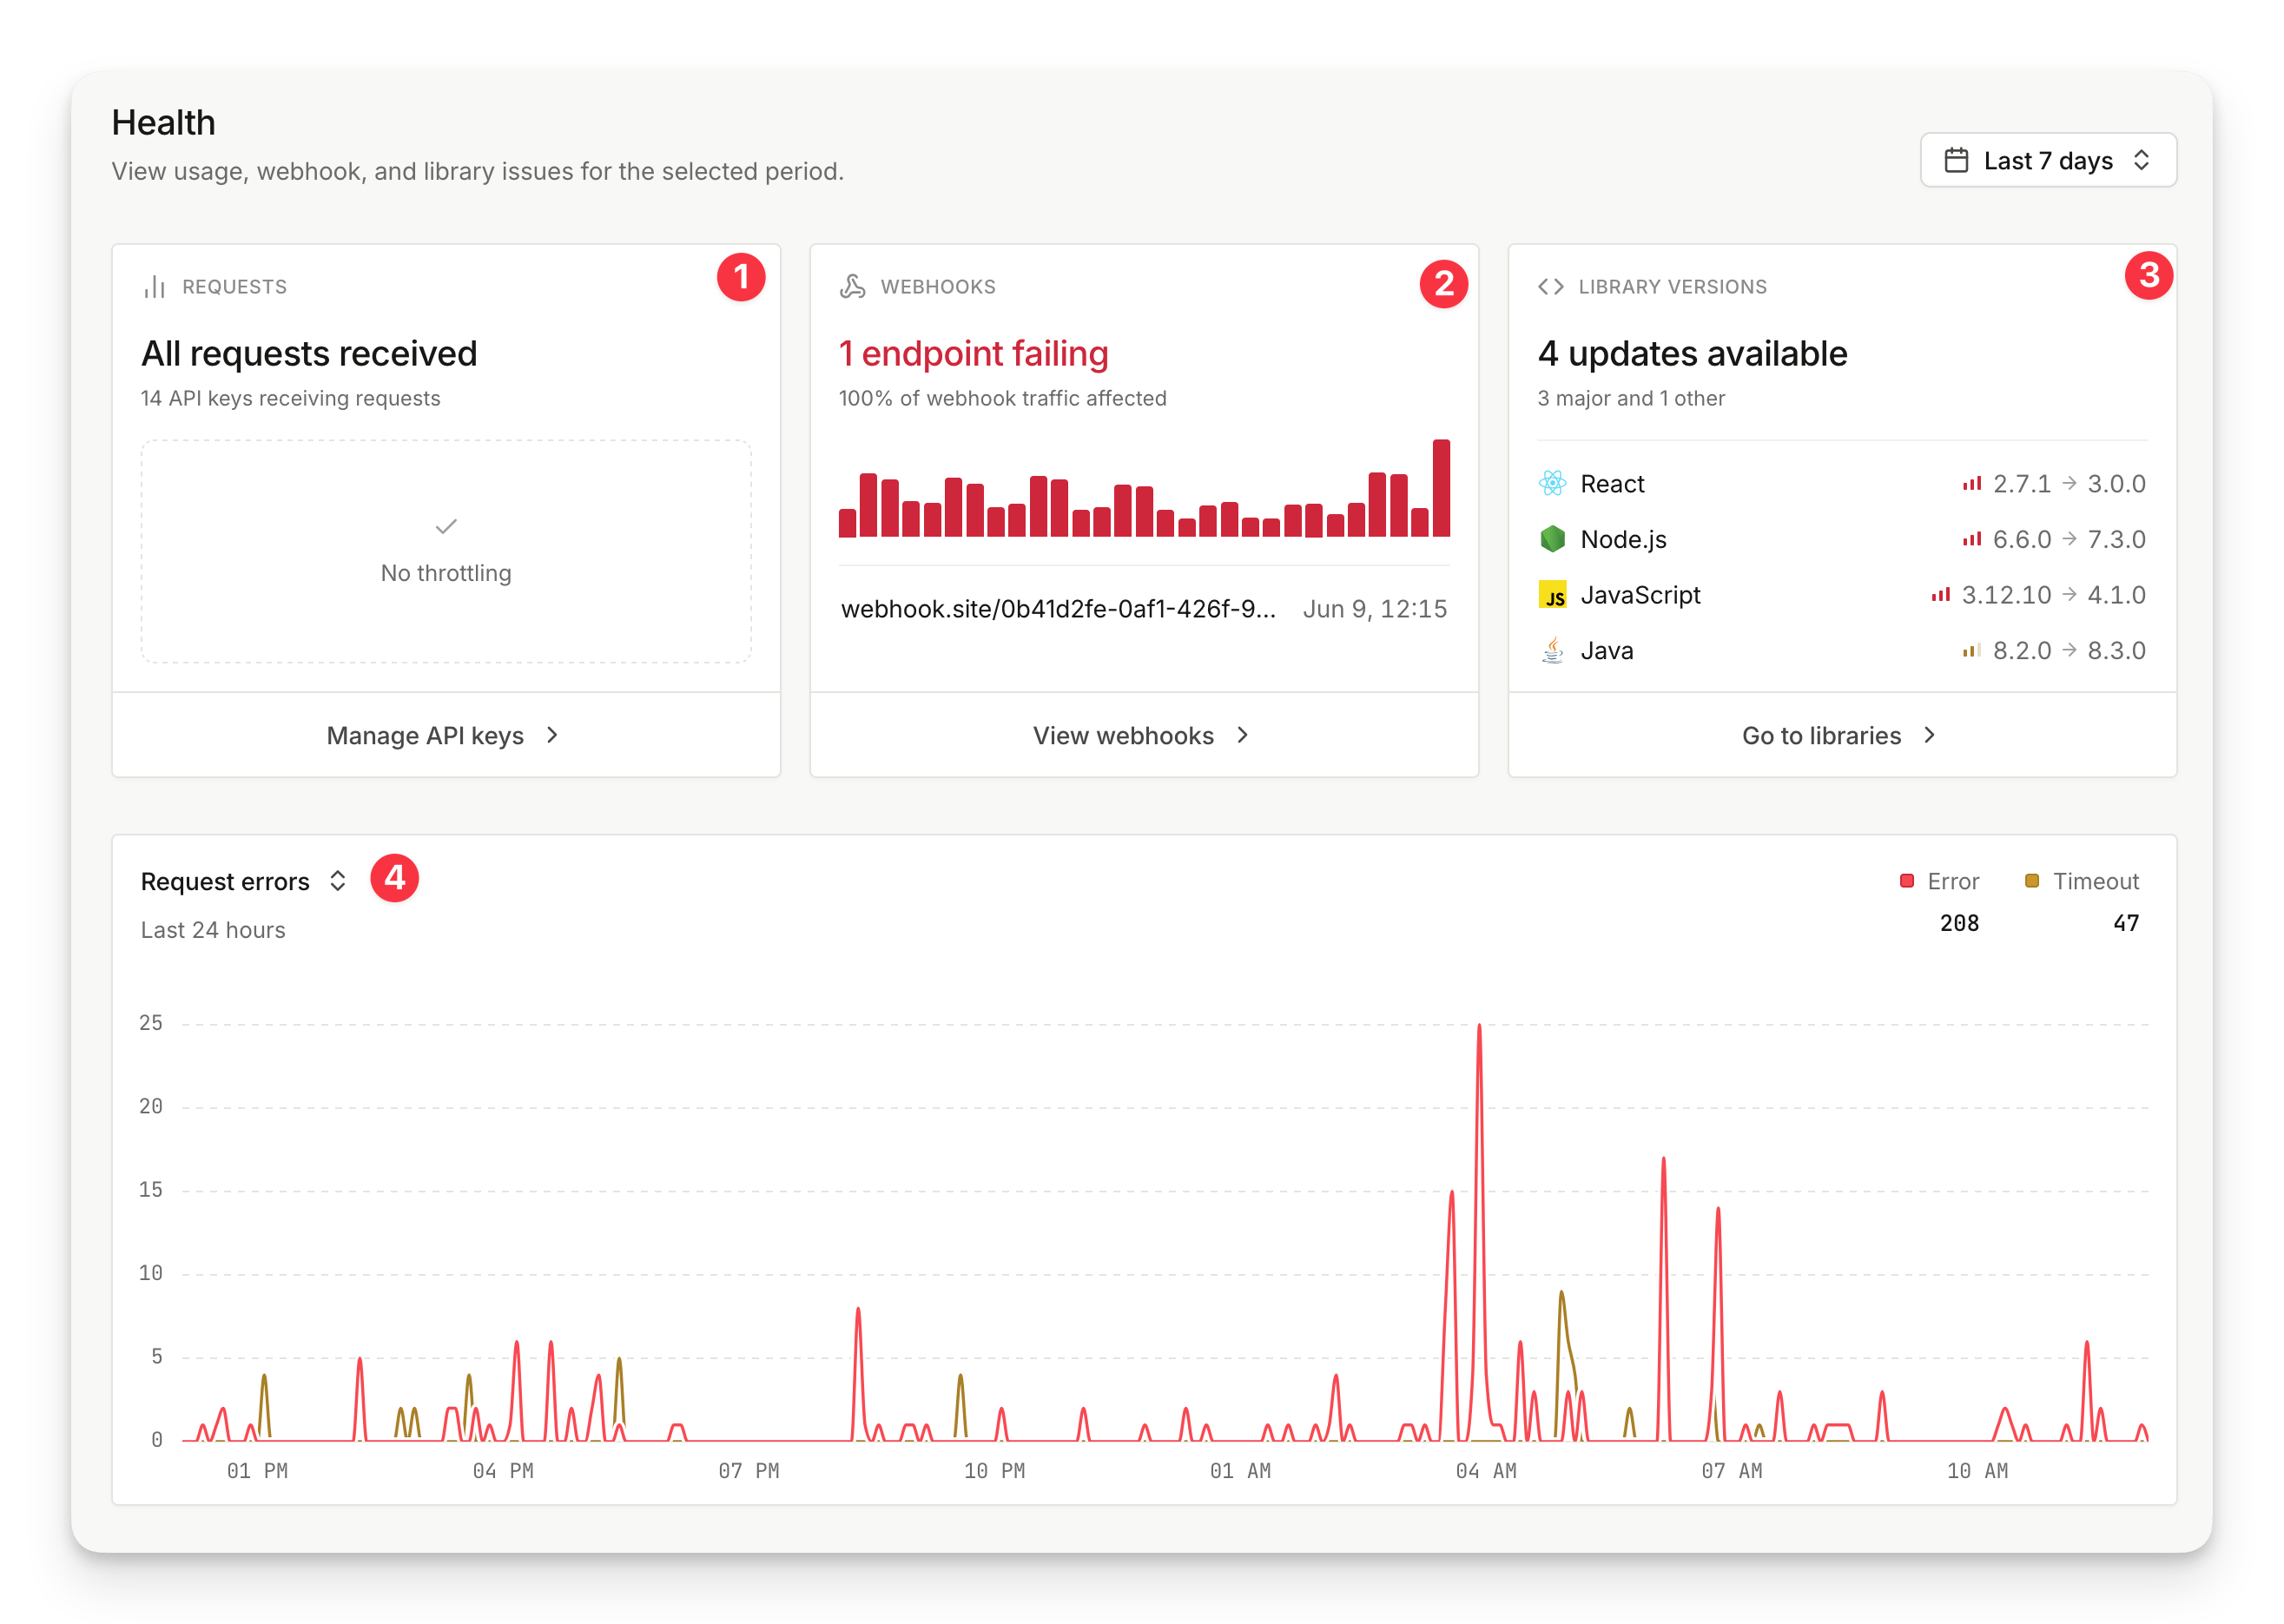
- Throttled requests (1) shows the total number of requests throttled in the current period, along with the API keys responsible. Each key links to its API key details, where you can adjust the RPS limit or investigate the traffic pattern.
- Webhooks (2) shows your webhook failure rate and the webhooks with the most recent delivery failures. Each entry links to its delivery logs.
- SDK versions (3) shows how many SDK updates are available across your integrations. Each entry shows the current version and the latest available version, and links to corresponding library page for the full breakdown.
- API Latency show the average latency for JavaScript agent requests, in 5-minute buckets. This is the time it takes a Fingerprint identification request to return data from the server. Only requests from client-side JavaScript SDKs are counted.
- API Errors shows requests that timed out or returned an error, including both client and server-side errors from the JavaScript agent.
- Webhook Failed Calls shows webhook delivery failures over time, broken down by webhook endpoint.
API key monitoring
For Public and Server API keys, you can view detailed monitoring information on the key details page. To check it out, visit Dashboard > API keys and select a key to view its details.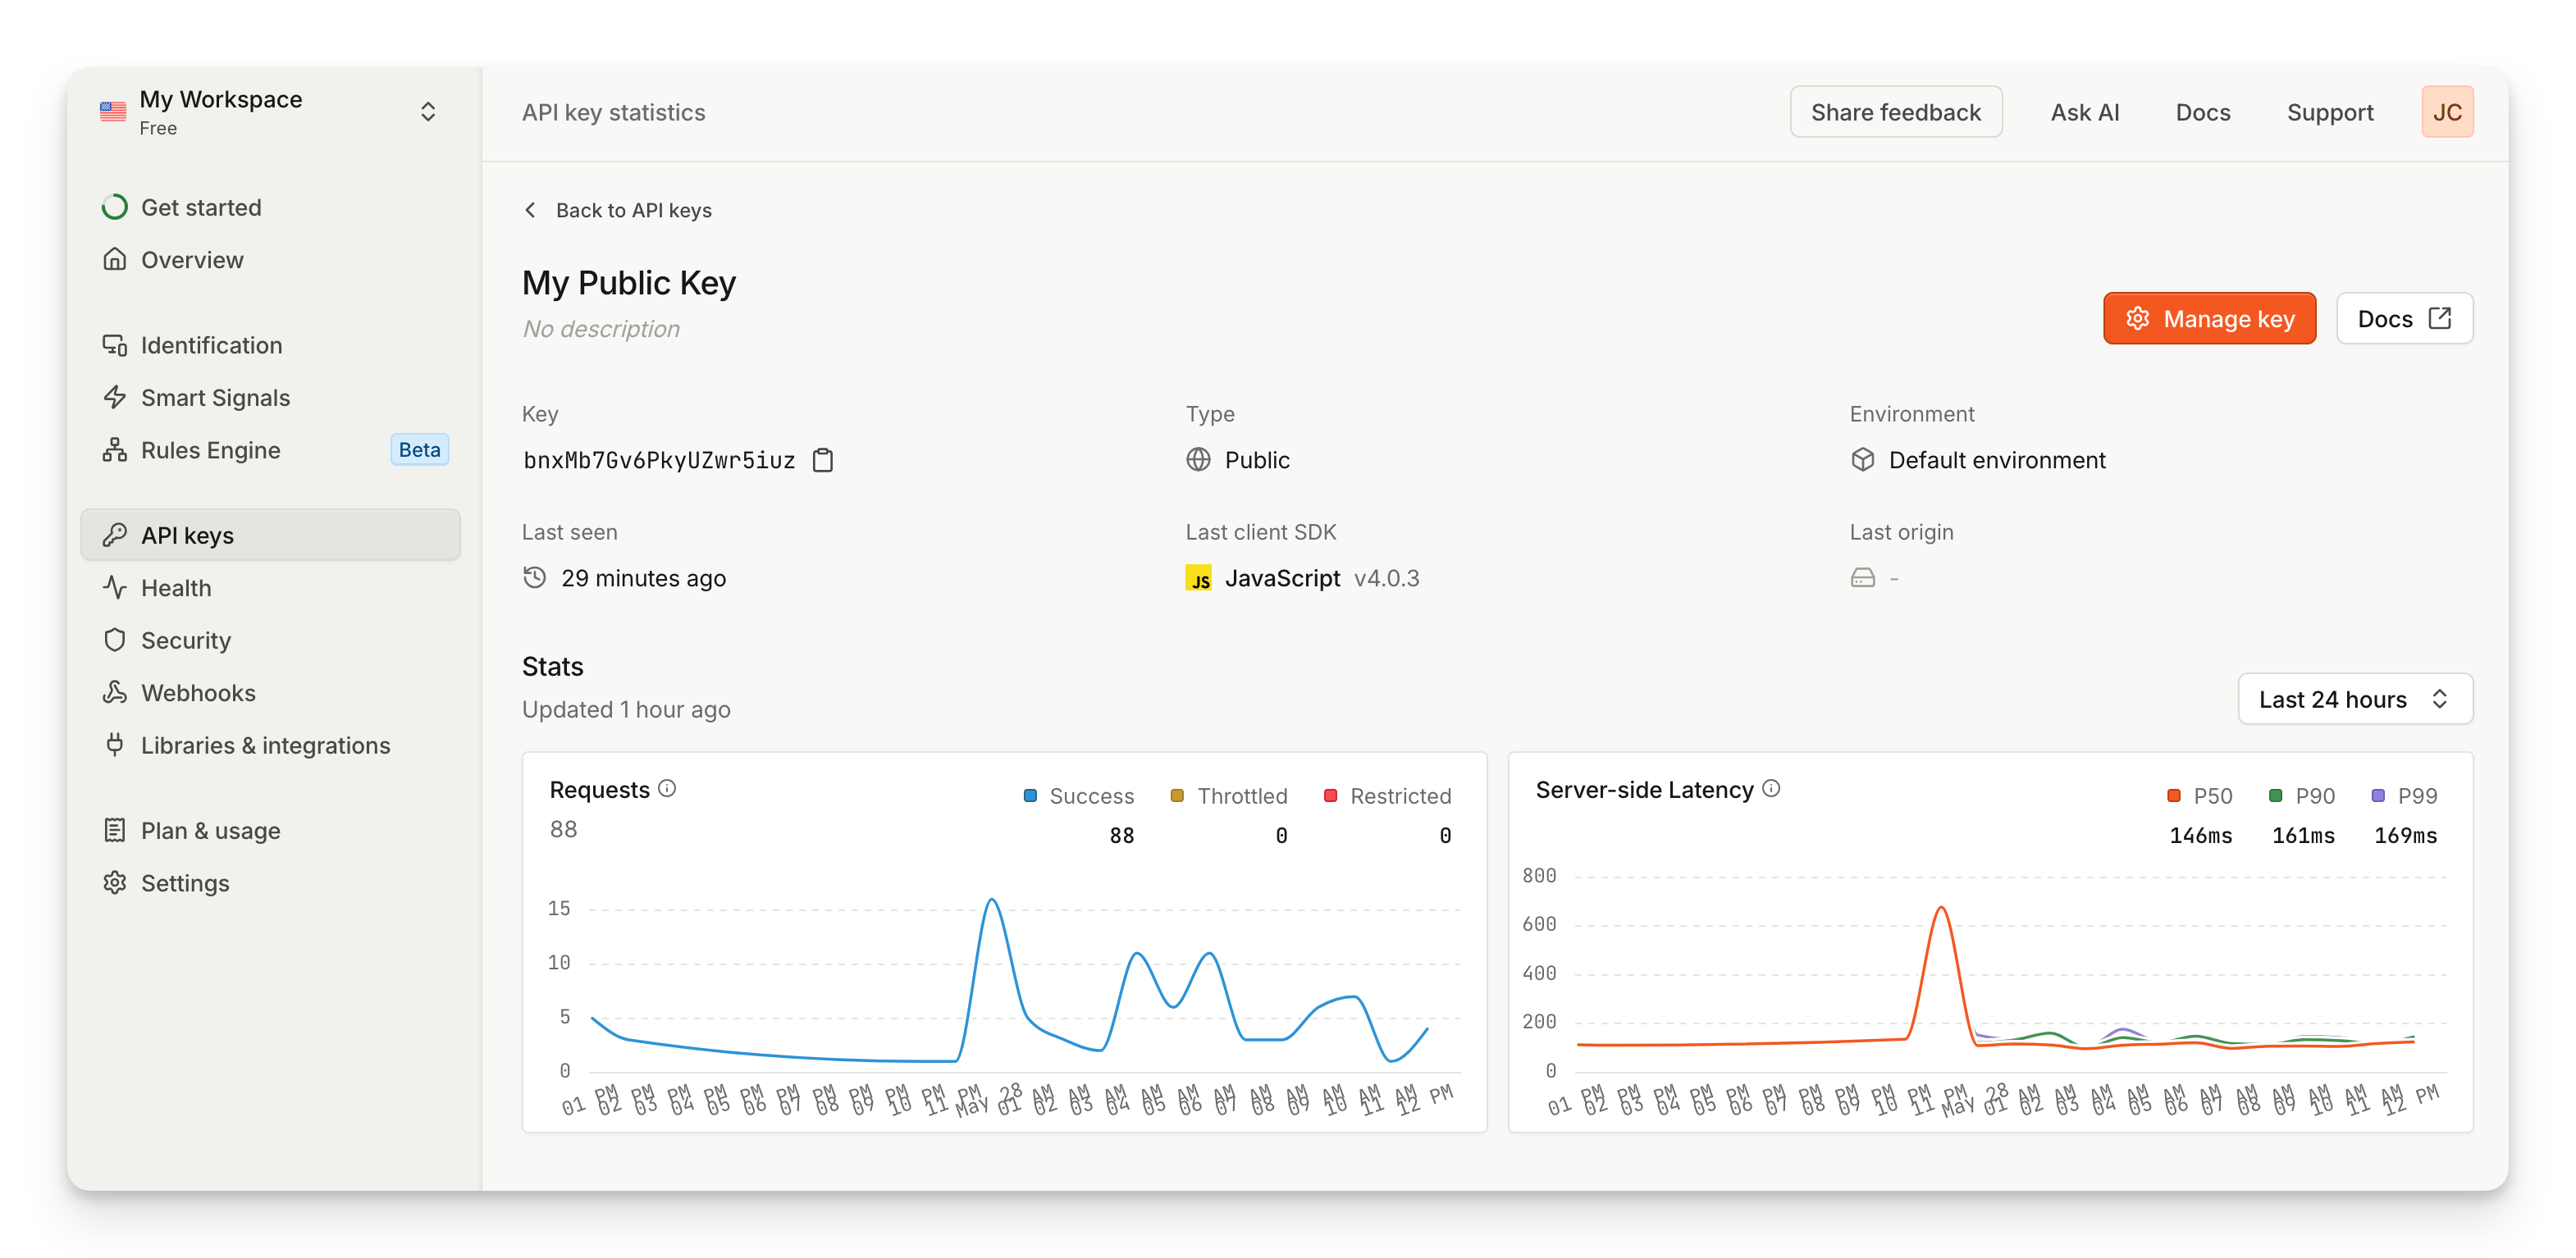
- The Request usage chart shows incoming identification requests using this API key, broken down into:
- Success - successful requests with response HTTP 200
- Throttled - requests over the configured RPS limit, responded with HTTP 429
- Restricted - requests filtered out by request filtering rules or that exceeded workspace/environment limits, responded with HTTP 403
- The Server-side latency chart shows percentiles for the average time to process identification requests. Client-side signal collection latency is not included.
Webhook monitoring
For each registered webhook, you can view a log of every delivery attempt by clicking into the webhook on the Webhooks page. To check it out, visit Dashboard > Webhooks and select a webhook.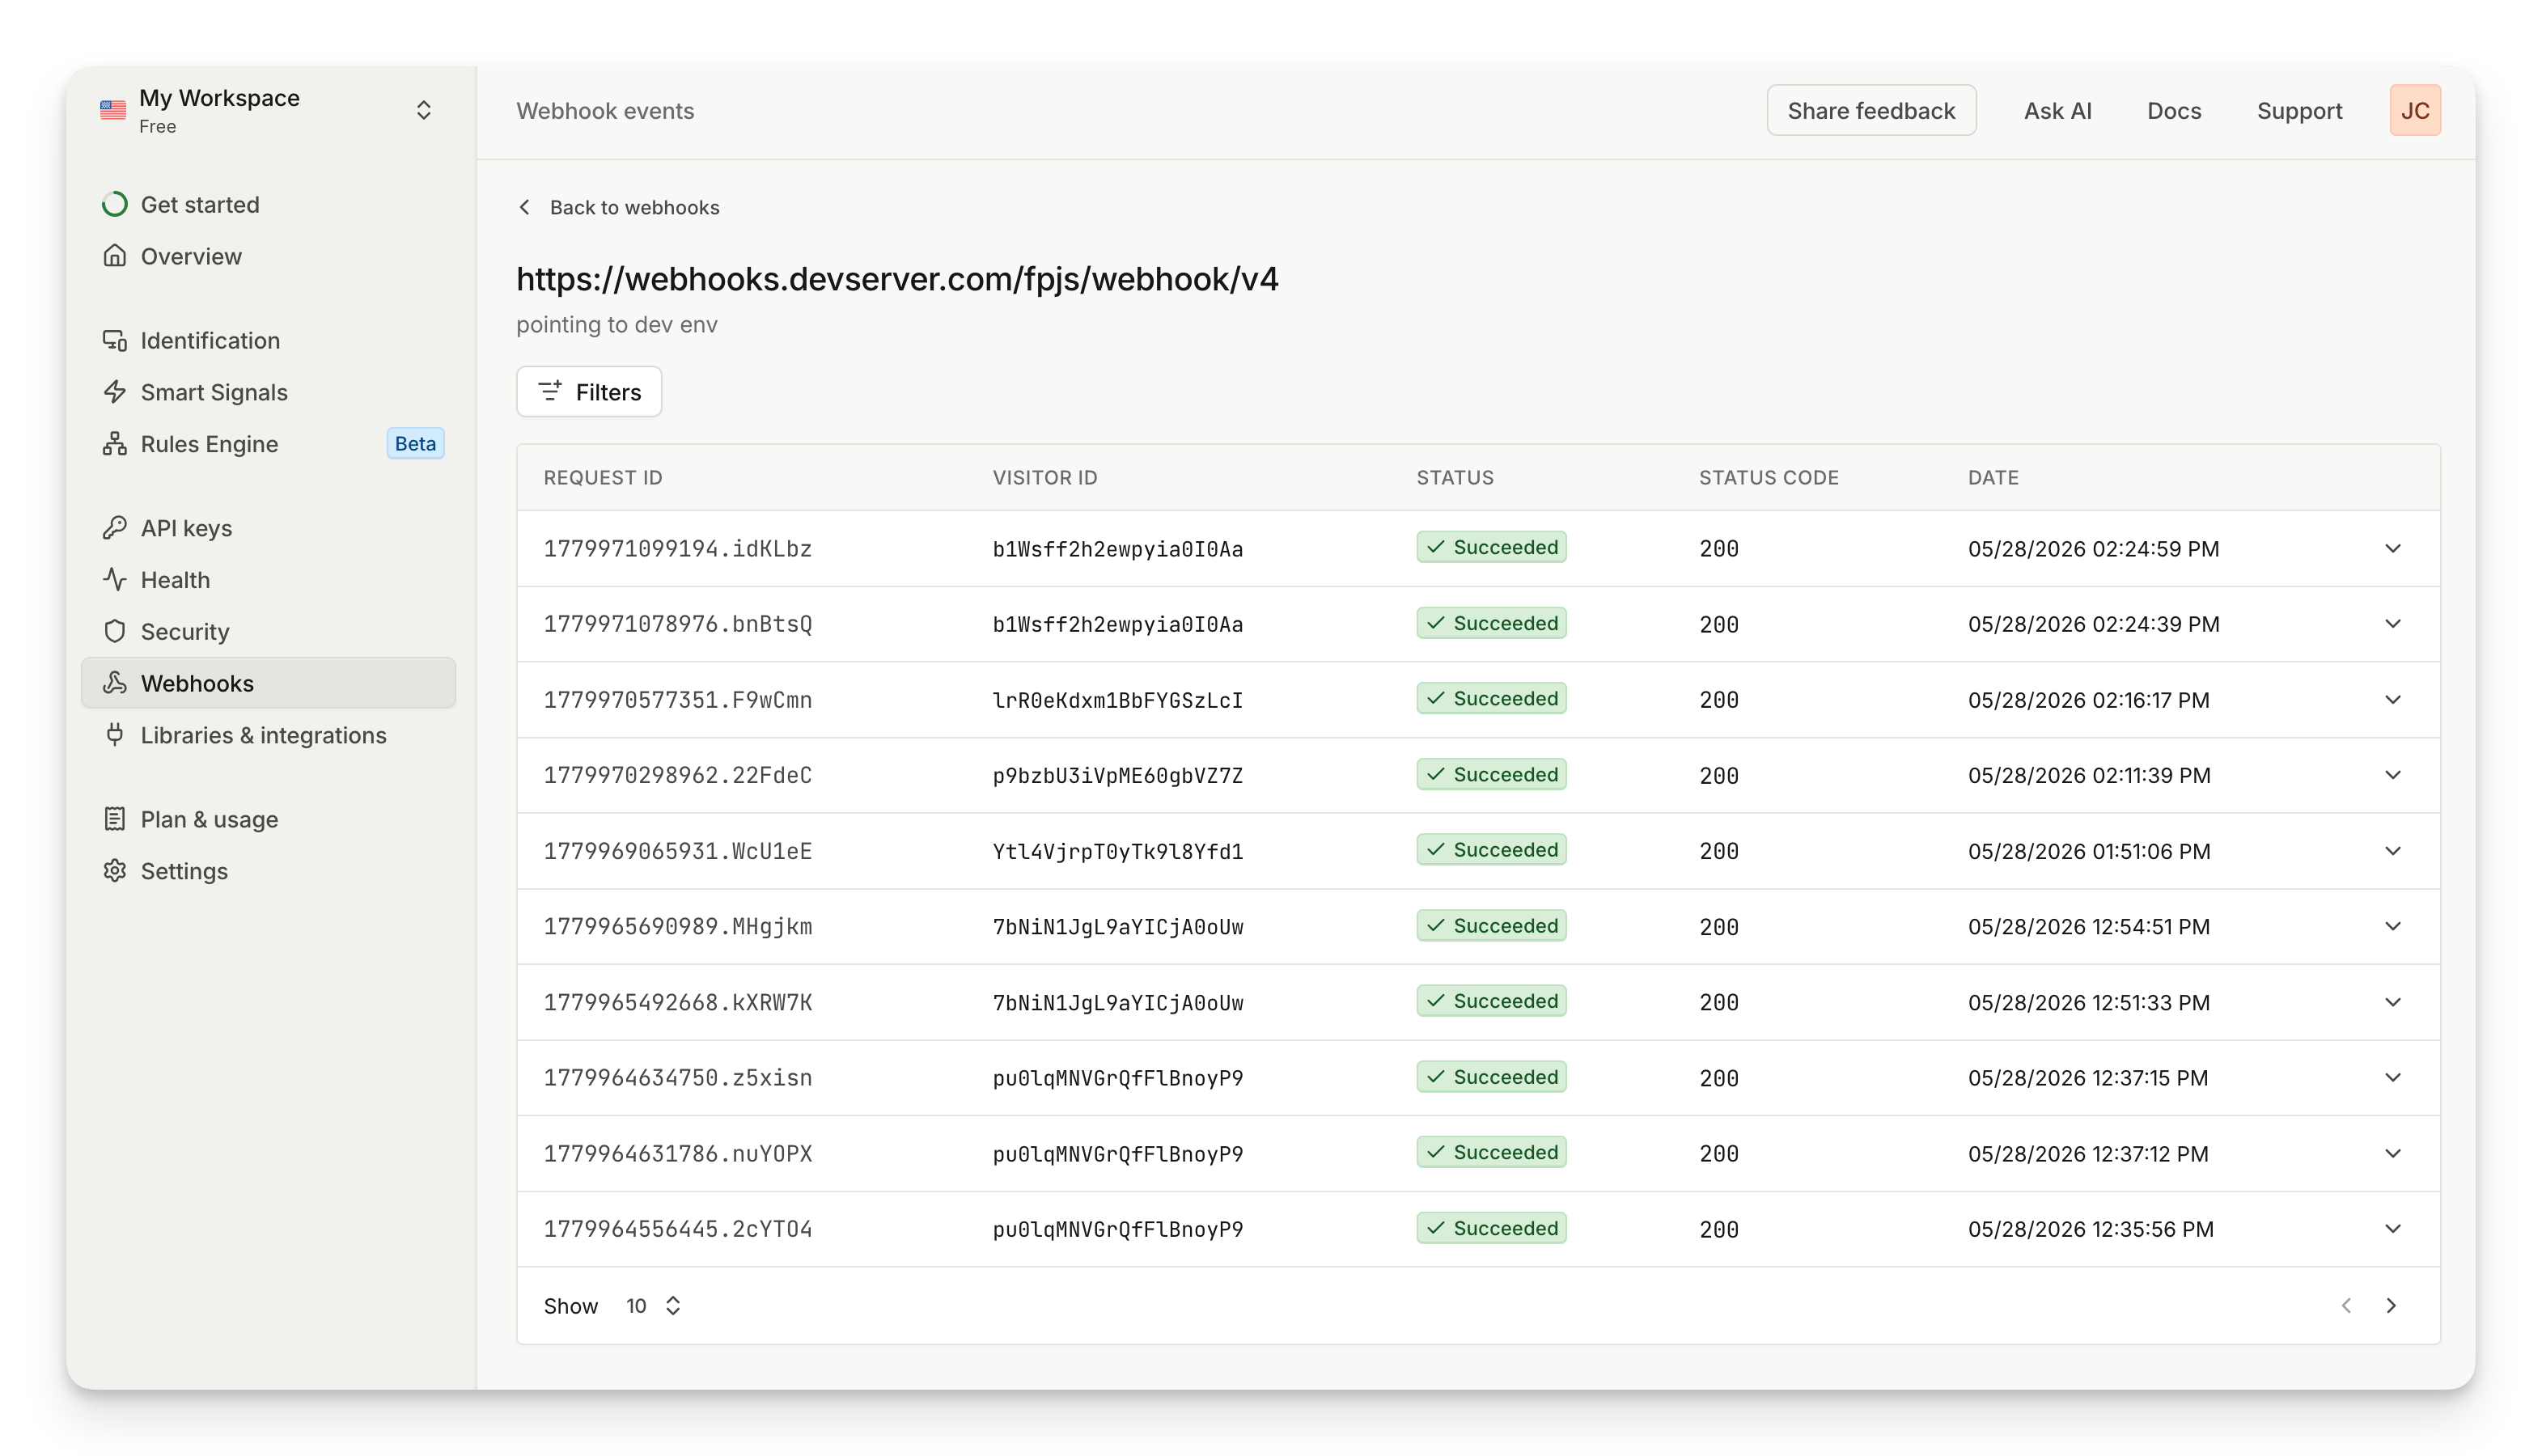
- Request ID - the identification request this delivery is associated with
- Visitor ID - the visitor ID from the event payload
- Status - whether the delivery succeeded or failed
- Status code - the HTTP response code returned by your endpoint
- Date - when the delivery was attempted
Outdated libraries
The Libraries & integrations page shows you a detailed view of all SDKs in use across your integrations, including both web and mobile SDKs as well as Server API SDKs. To check it out, visit Dashboard > Libraries & integrations.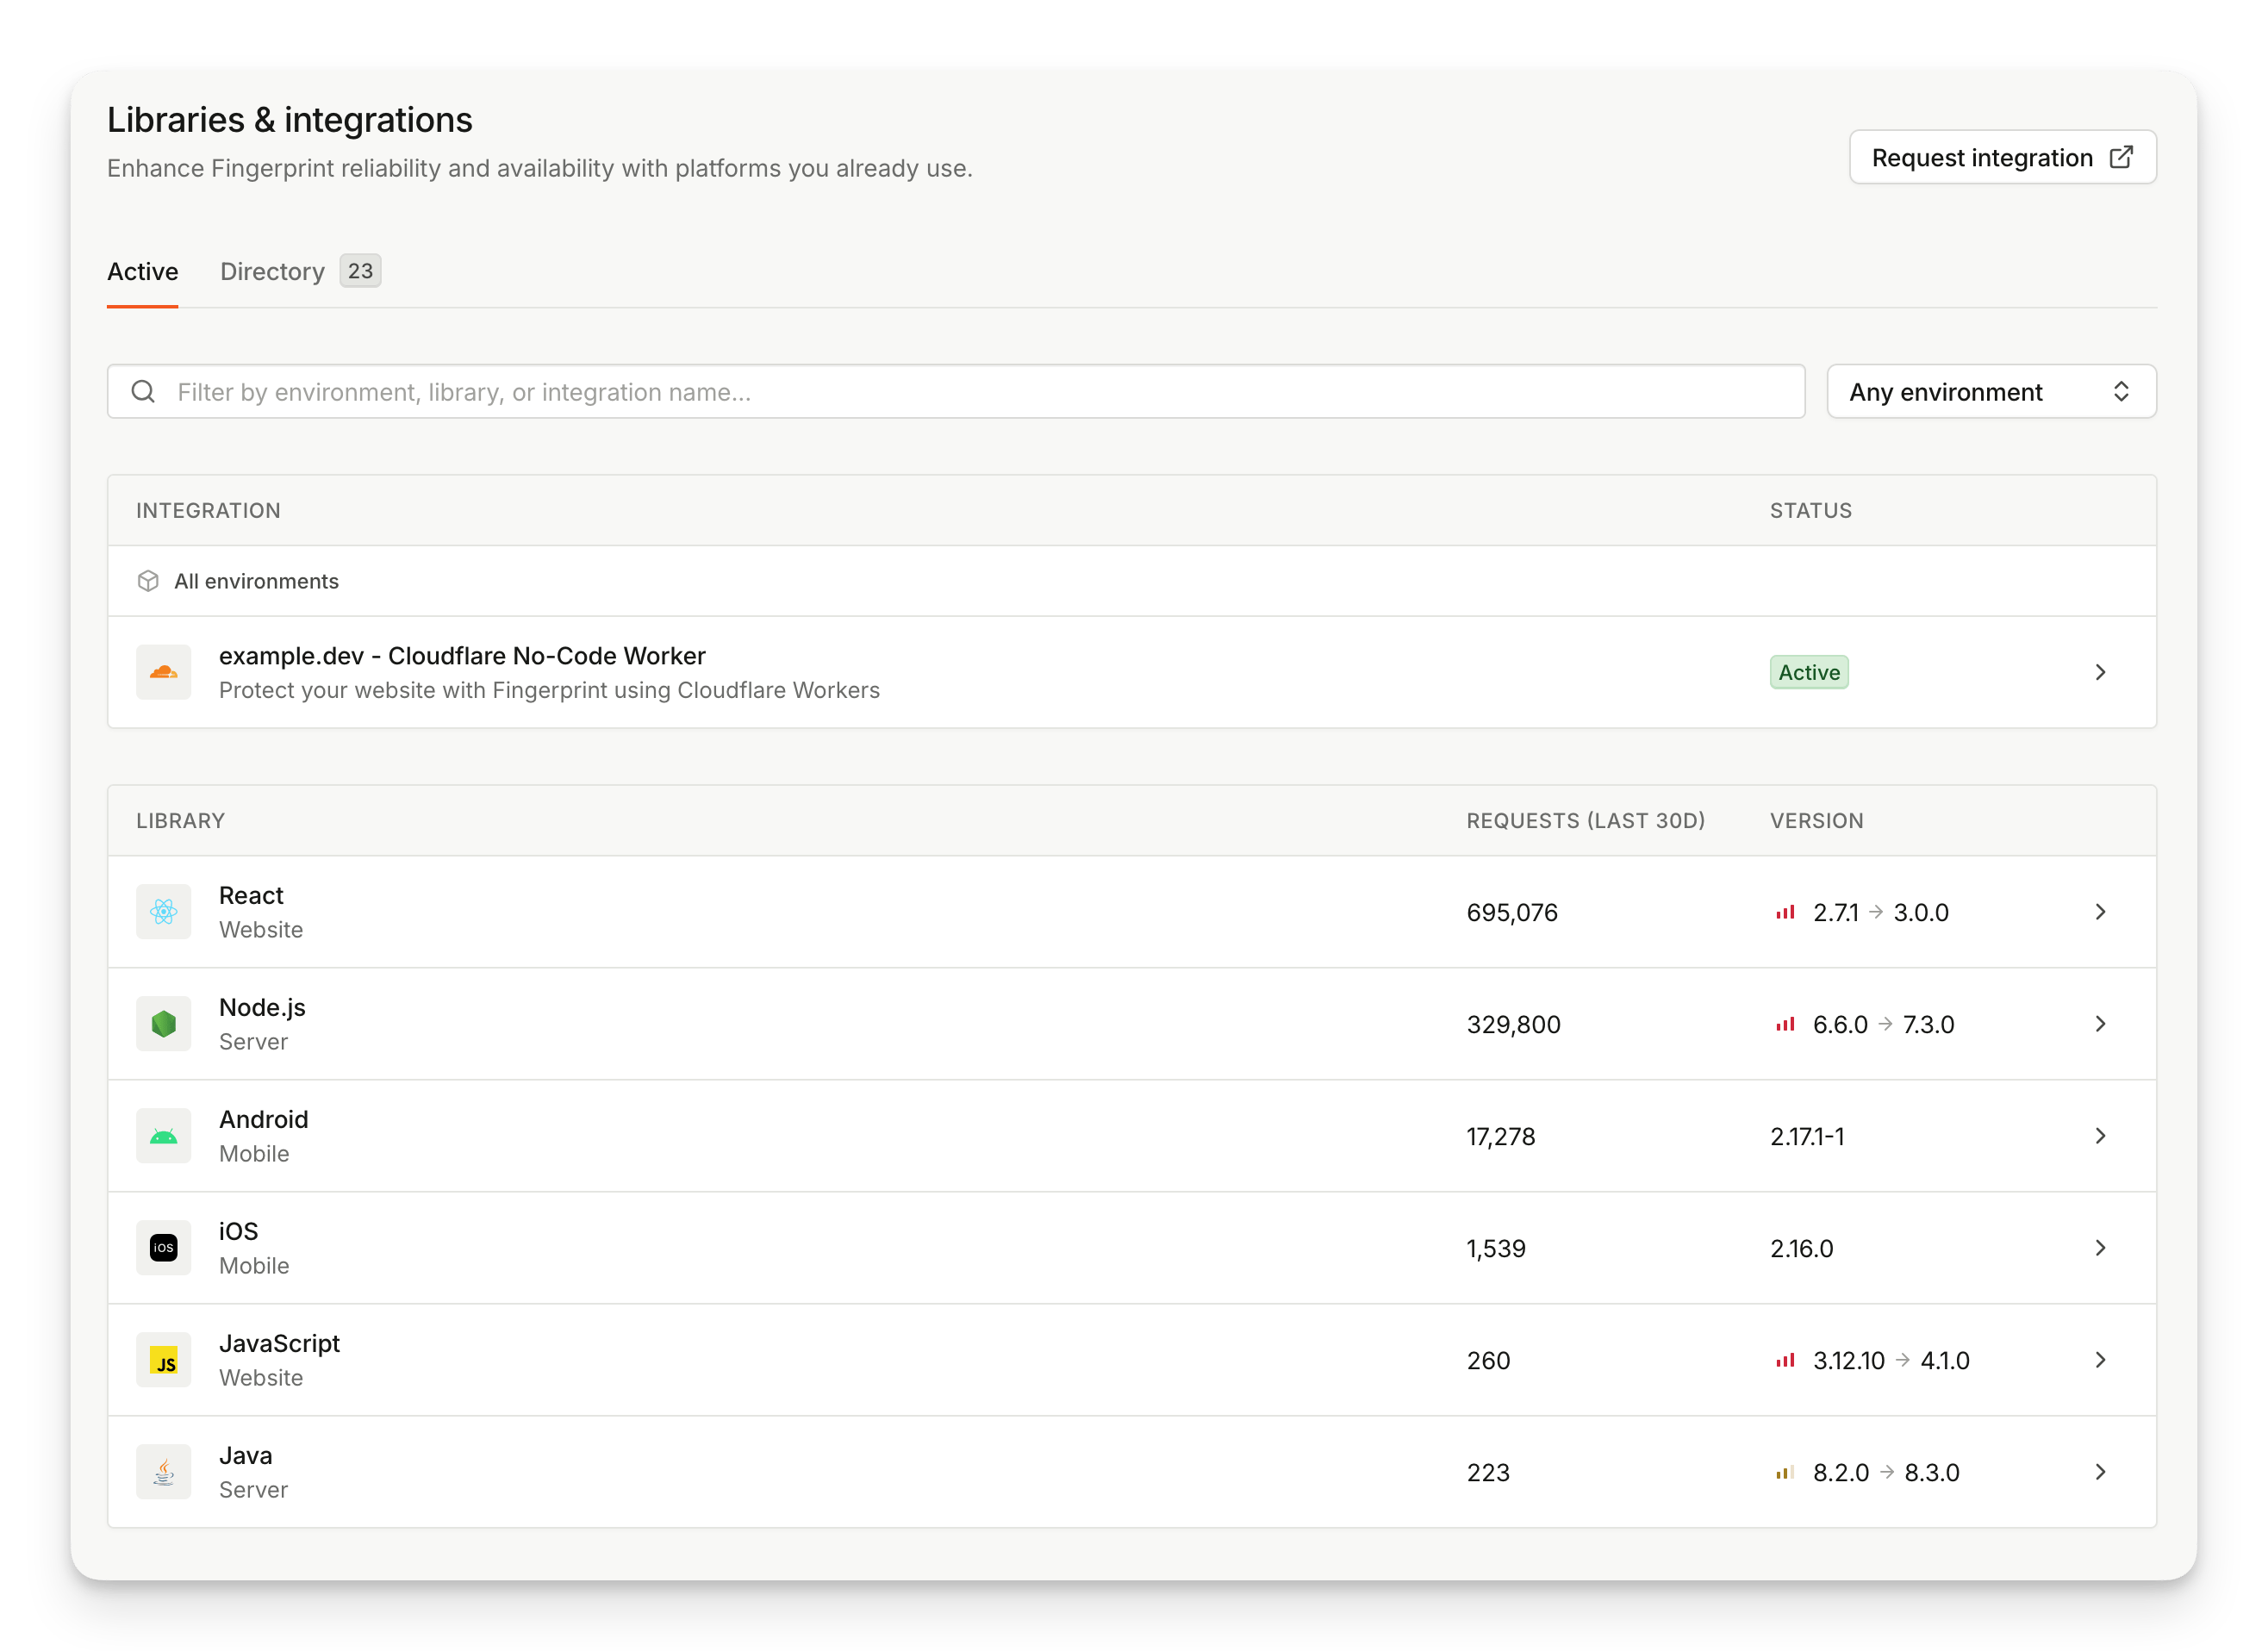
- The library (e.g. JavaScript, Next.js, Node.js, iOS) and where it runs (Website, Server, or App)
- The number of requests in the last 24 hours
- The version in use, and the latest version available
Per-library health
Clicking an active library opens its Health tab, which gives you a detailed view of where that SDK is running and which deployments are out of date.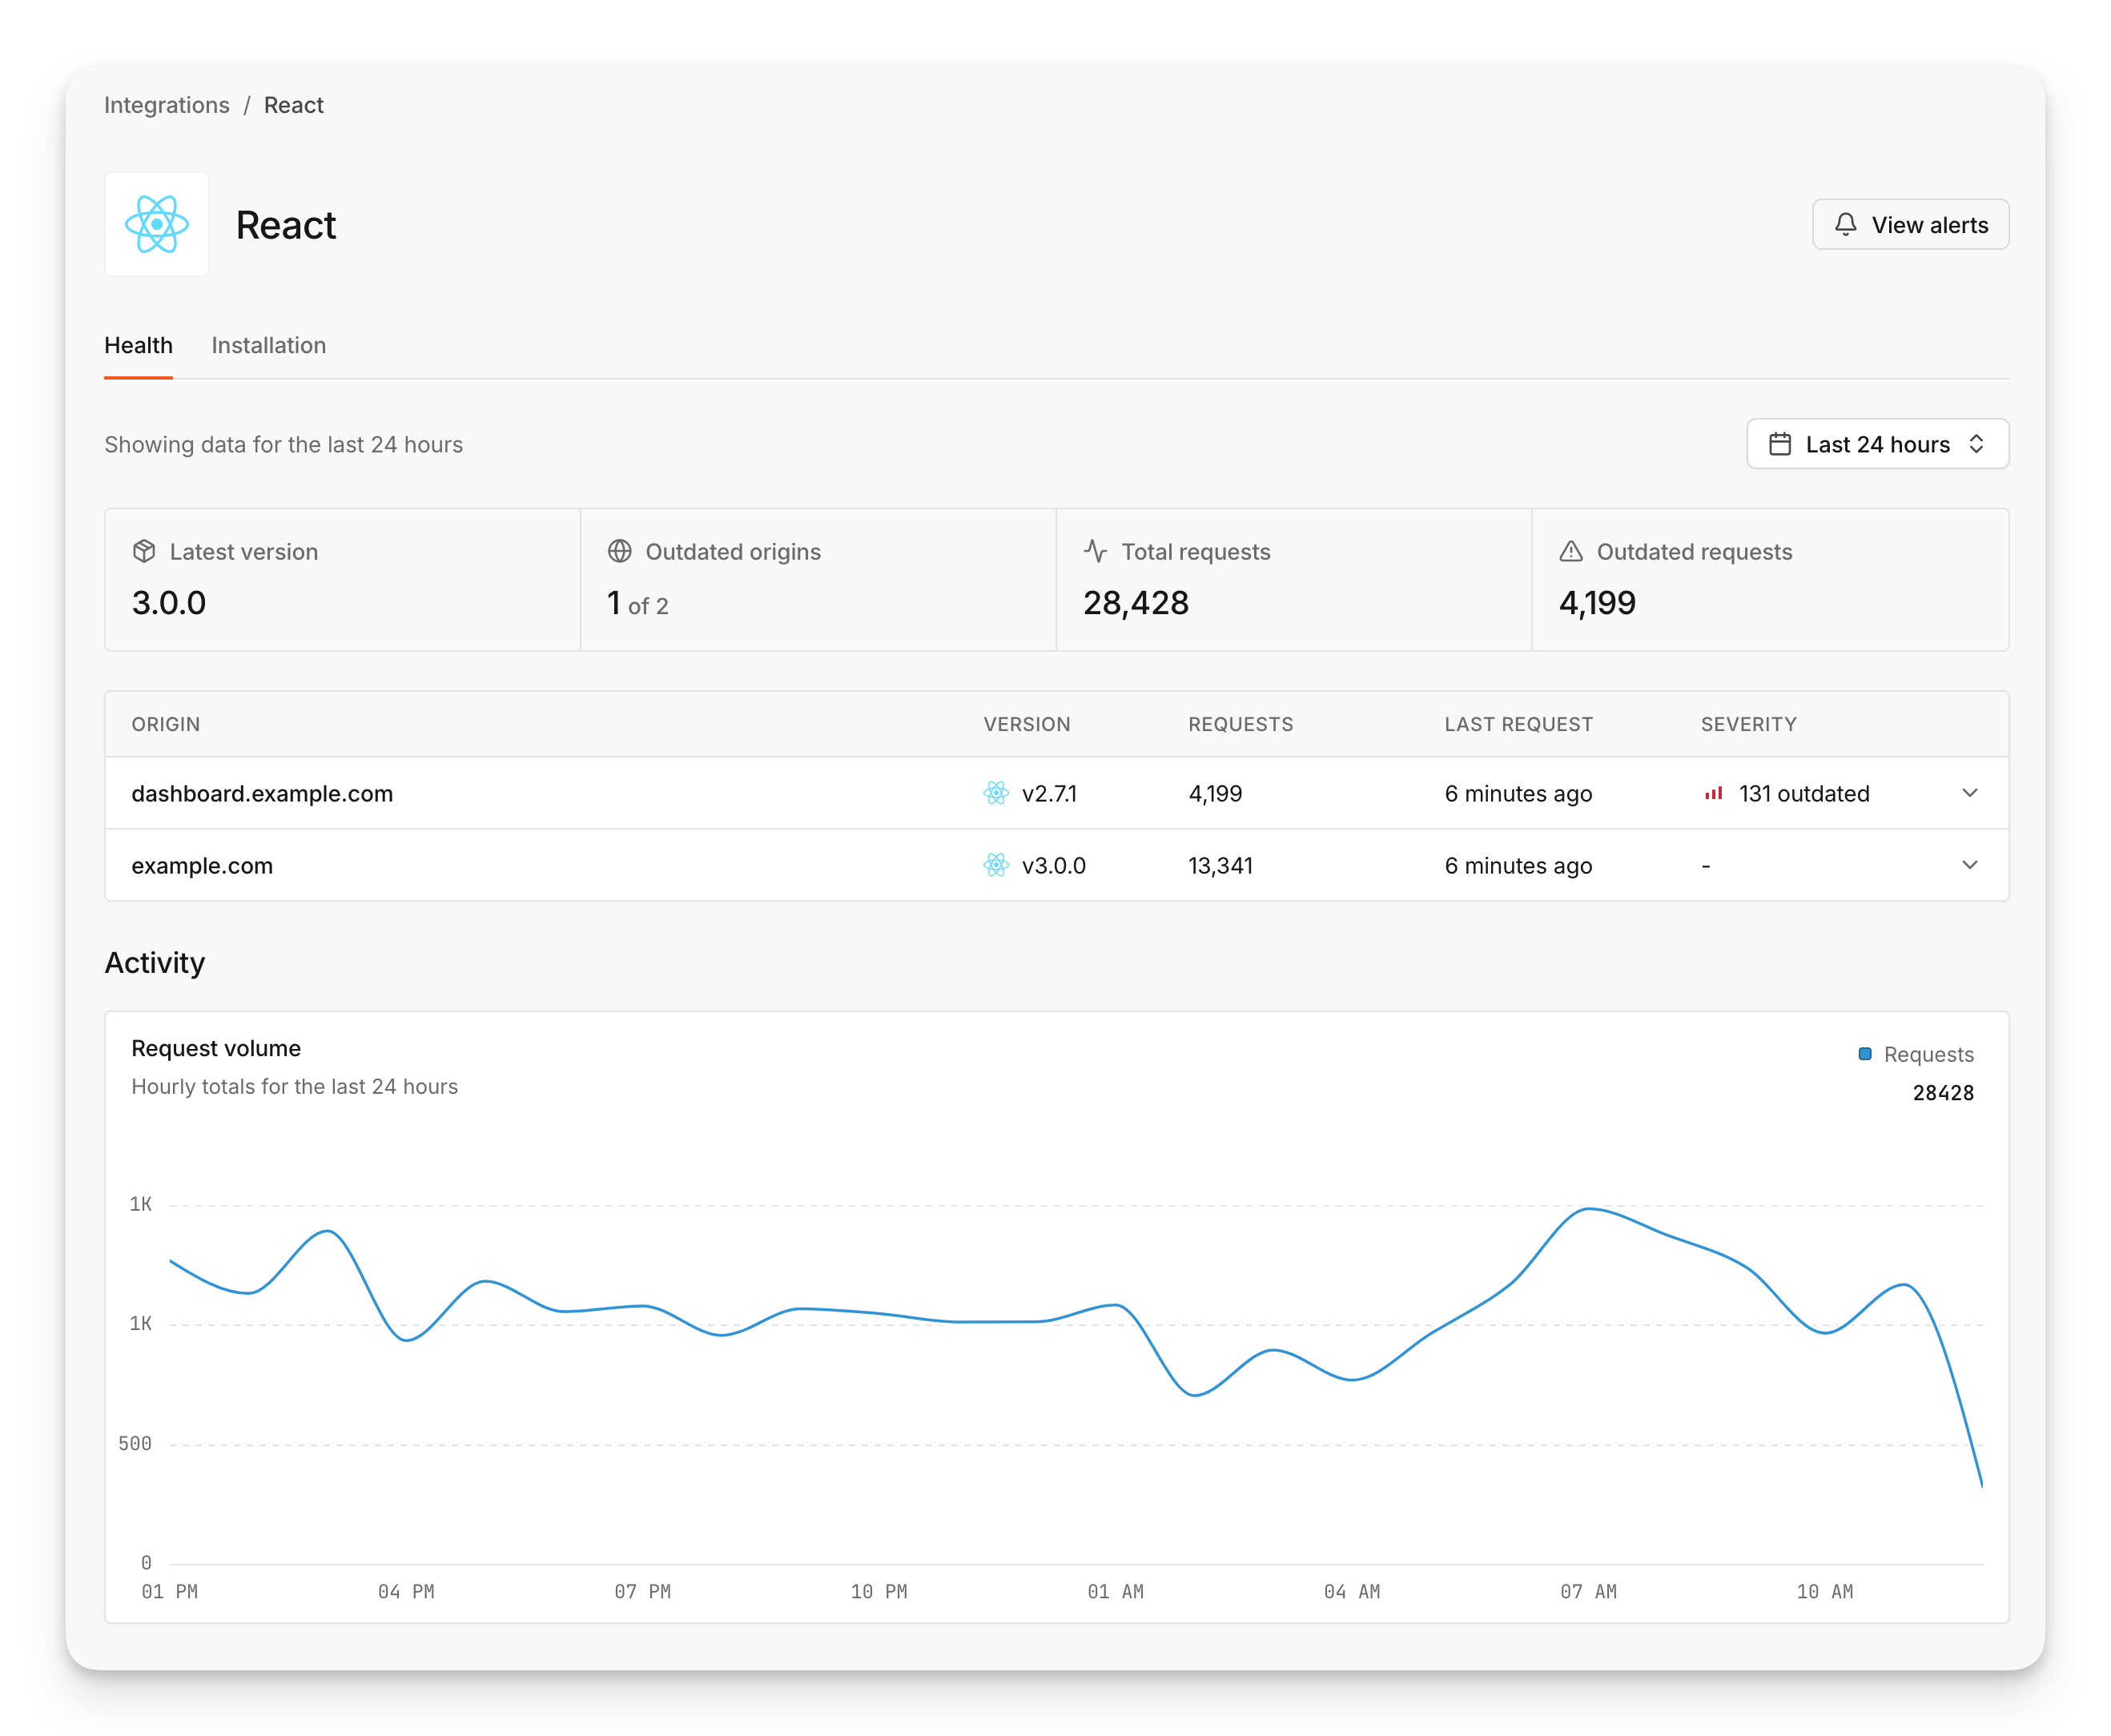
- The latest version of the library
- The number of outdated origins out of the total observed
- Total requests in the selected window
- How many of those requests came from outdated versions
- Origin - the domain or app ID
- Version - the SDK version in use, or a “Multiple” label when more than one version is detected
- Requests - the number of identification requests from this origin in the selected window
- Last request - timestamp of the most recent request
- Severity - whether the origin is up to date, or how far behind it is