The Overview page serves as the homepage for the Dashboard, displaying key insights and metrics at a glance. The page features a row of selected key metrics, a timeline chart, and distribution lists. The page also features a date range filter, and an environment filter.You can access the Overview page by visiting Dashboard > Overview.
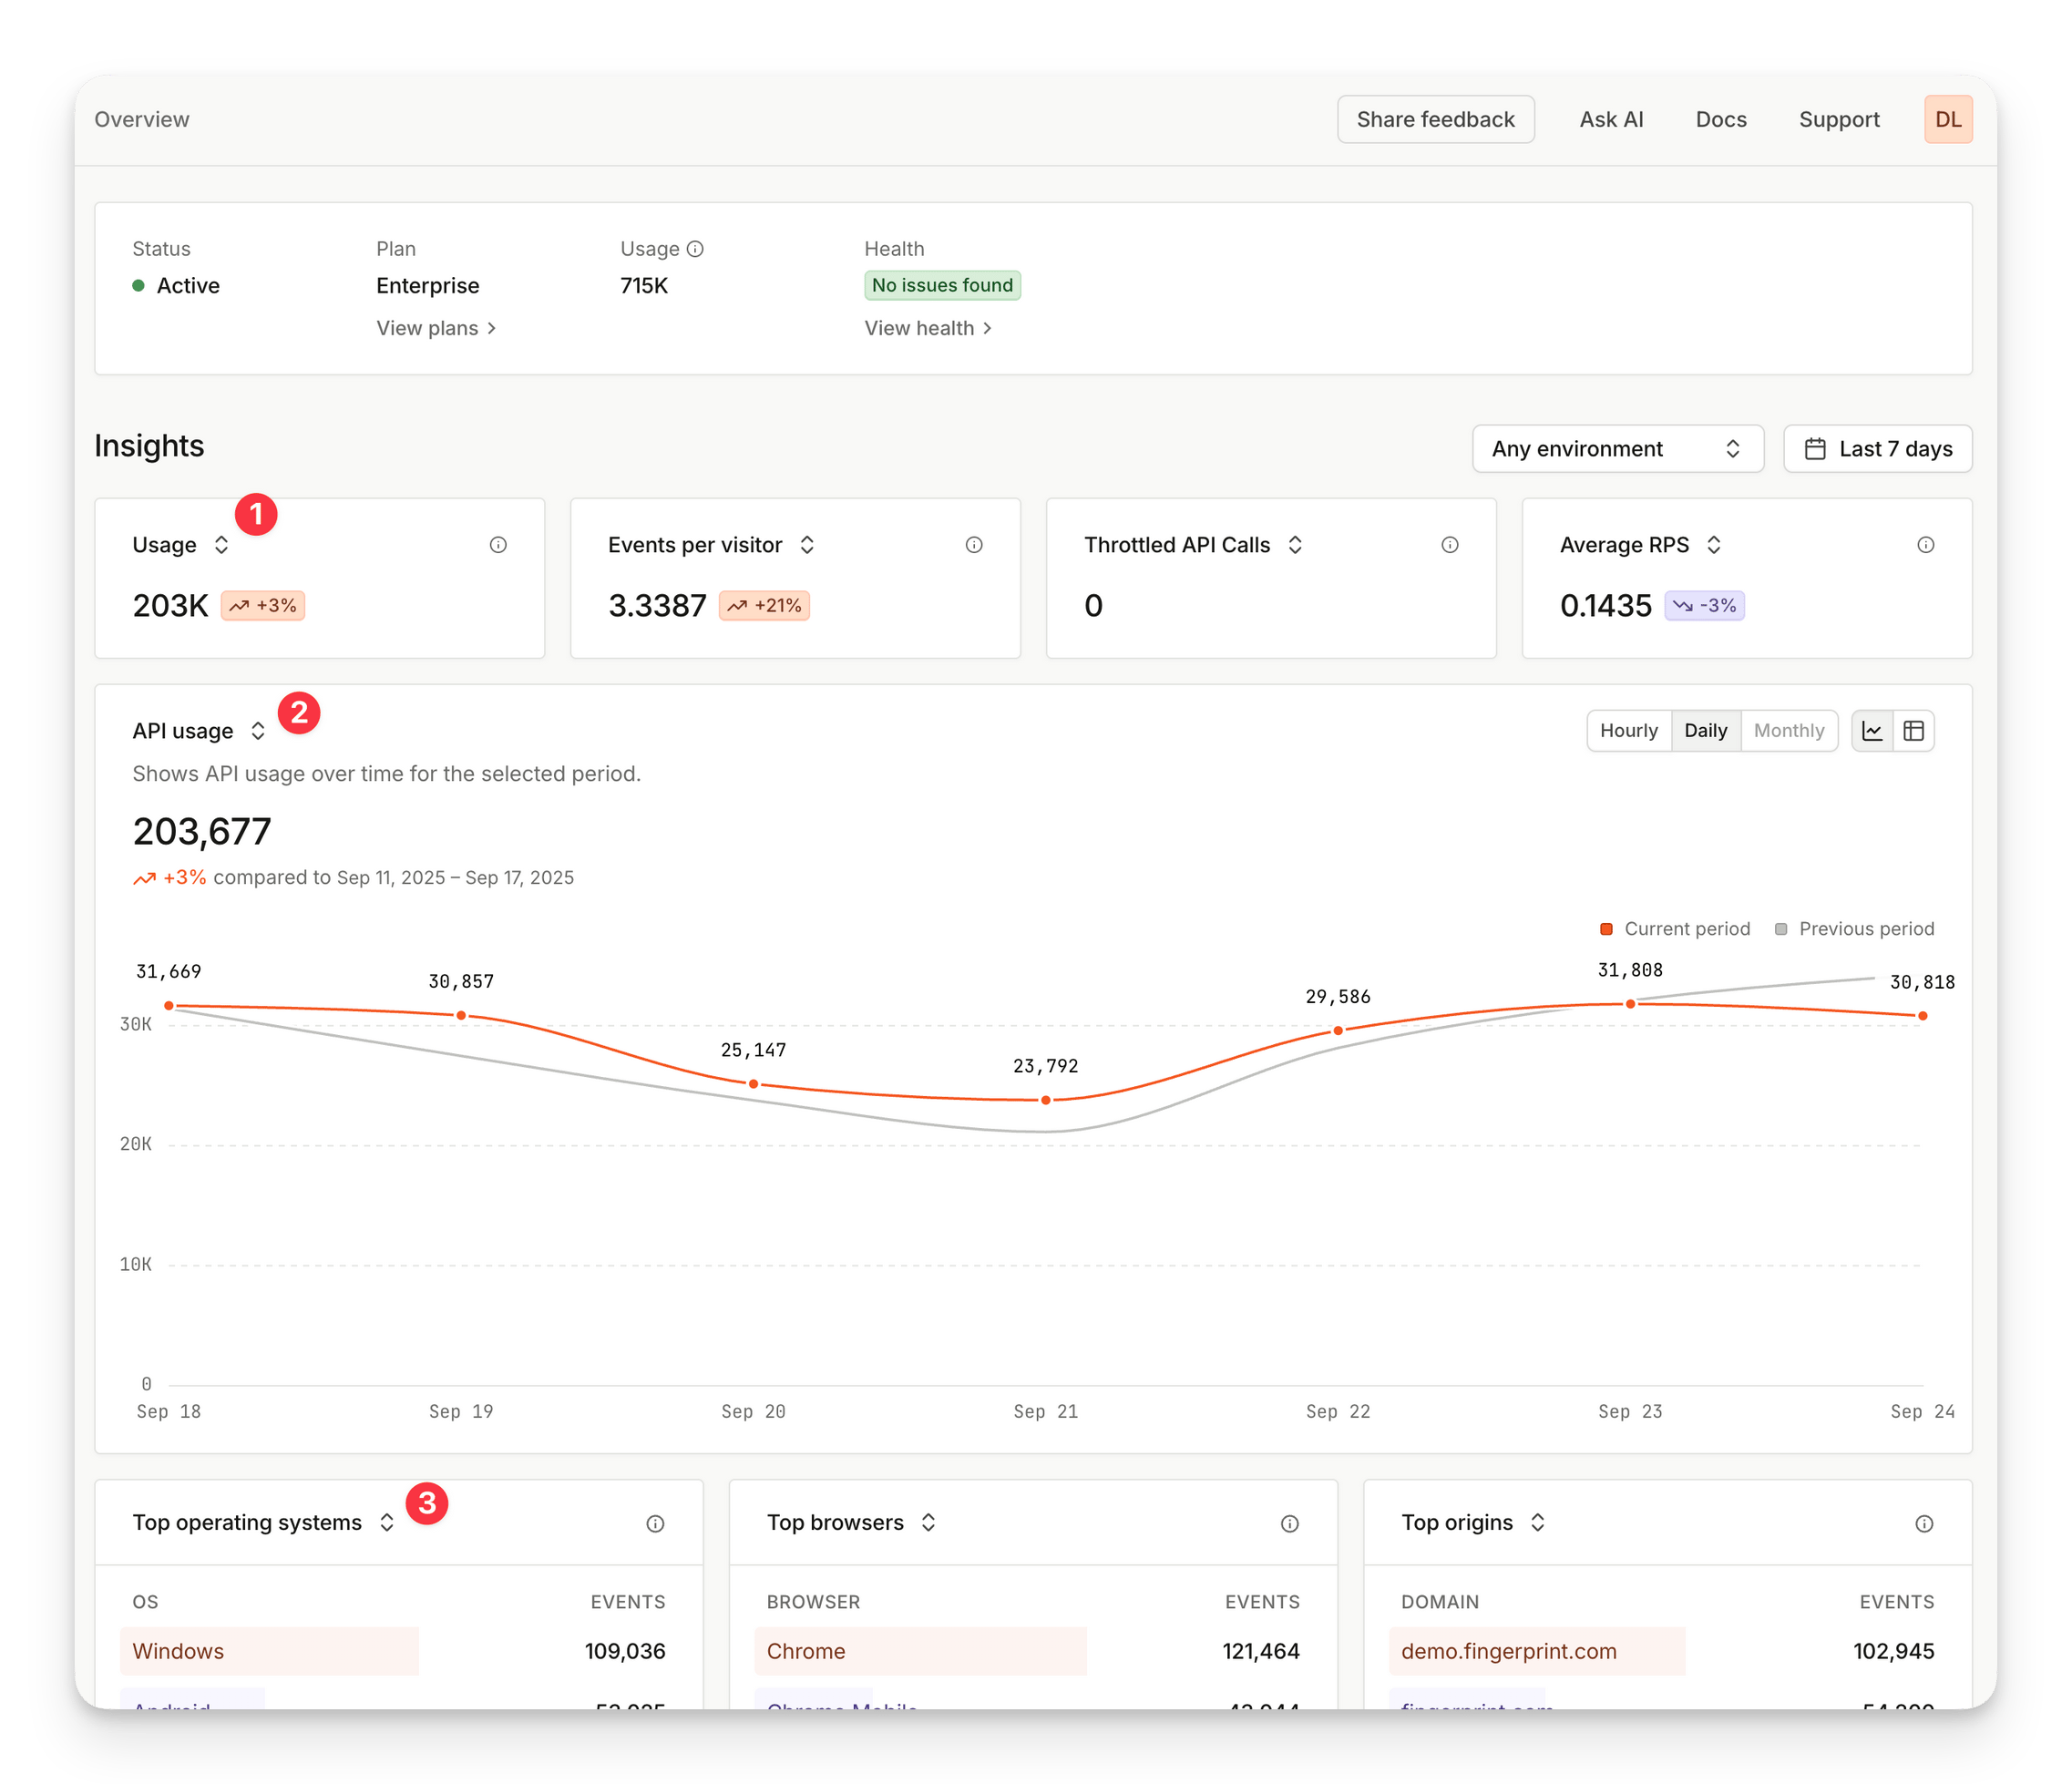
The key metrics (1) provide you with information and insights about your integration at a glance.
Show available key metrics
Metric
Description
API usage
Number of identification requests made in the selected period
Number of unique visitors
Number of distinct visitor IDs seen in the selected period
Events per visitor ratio
Average number of identification events for every uniquely identified visitor
Number of restricted API calls
Number of API calls that were restricted due to request filtering rules, exceeding limits on your environments, or exceeding limits on your workspace plan
Number of throttled API calls
Number of API calls that went over the RPS limit and were throttled
Average requests per second (RPS)
Rolling average number of requests per second in the selected period
Peak requests per second (RPS)
Peak number of requests per second in 5-minute window
The timeline chart (2) provides a view into key metrics over time (hourly, daily, monthly), and shows comparison to the previous period.
Show available timeline views
Timeline view
Description
API usage
Displays a timeline chart of API usage, comparing currently selected period to the previous period
Events per visitor
Shows the timeline chart of the ratio of identification requests per unique visitor ID
Failed API calls
Shows the number of throttled and restricted API calls for the selected period
Requests per second (RPS)
Shows API usage bandwidth as average and peak requests per second, for the selected period
The distribution lists (3) display top lists of observed entities sorted by number of events associated with each entity.
Show available distribution lists
Distribution list
Description
Top browsers
List of web browsers
Top client types
List of client SDK platforms
Top client versions
List of specific client SDK versions
Top countries
List of originating countries
Top operating systems
List of originating operating systems
Top origins
List of origin domains or mobile app identifiers
Top URLs
List of specific URLs where events were recorded
You can view statistics for up to the past 12 months.
The Identification page lists all recent identification events, allows you to find specific events, and dive deep into their details. The page also features a date range filter, and a wide array of other filtering options.You can access the Identification page by visiting Dashboard > Identification.
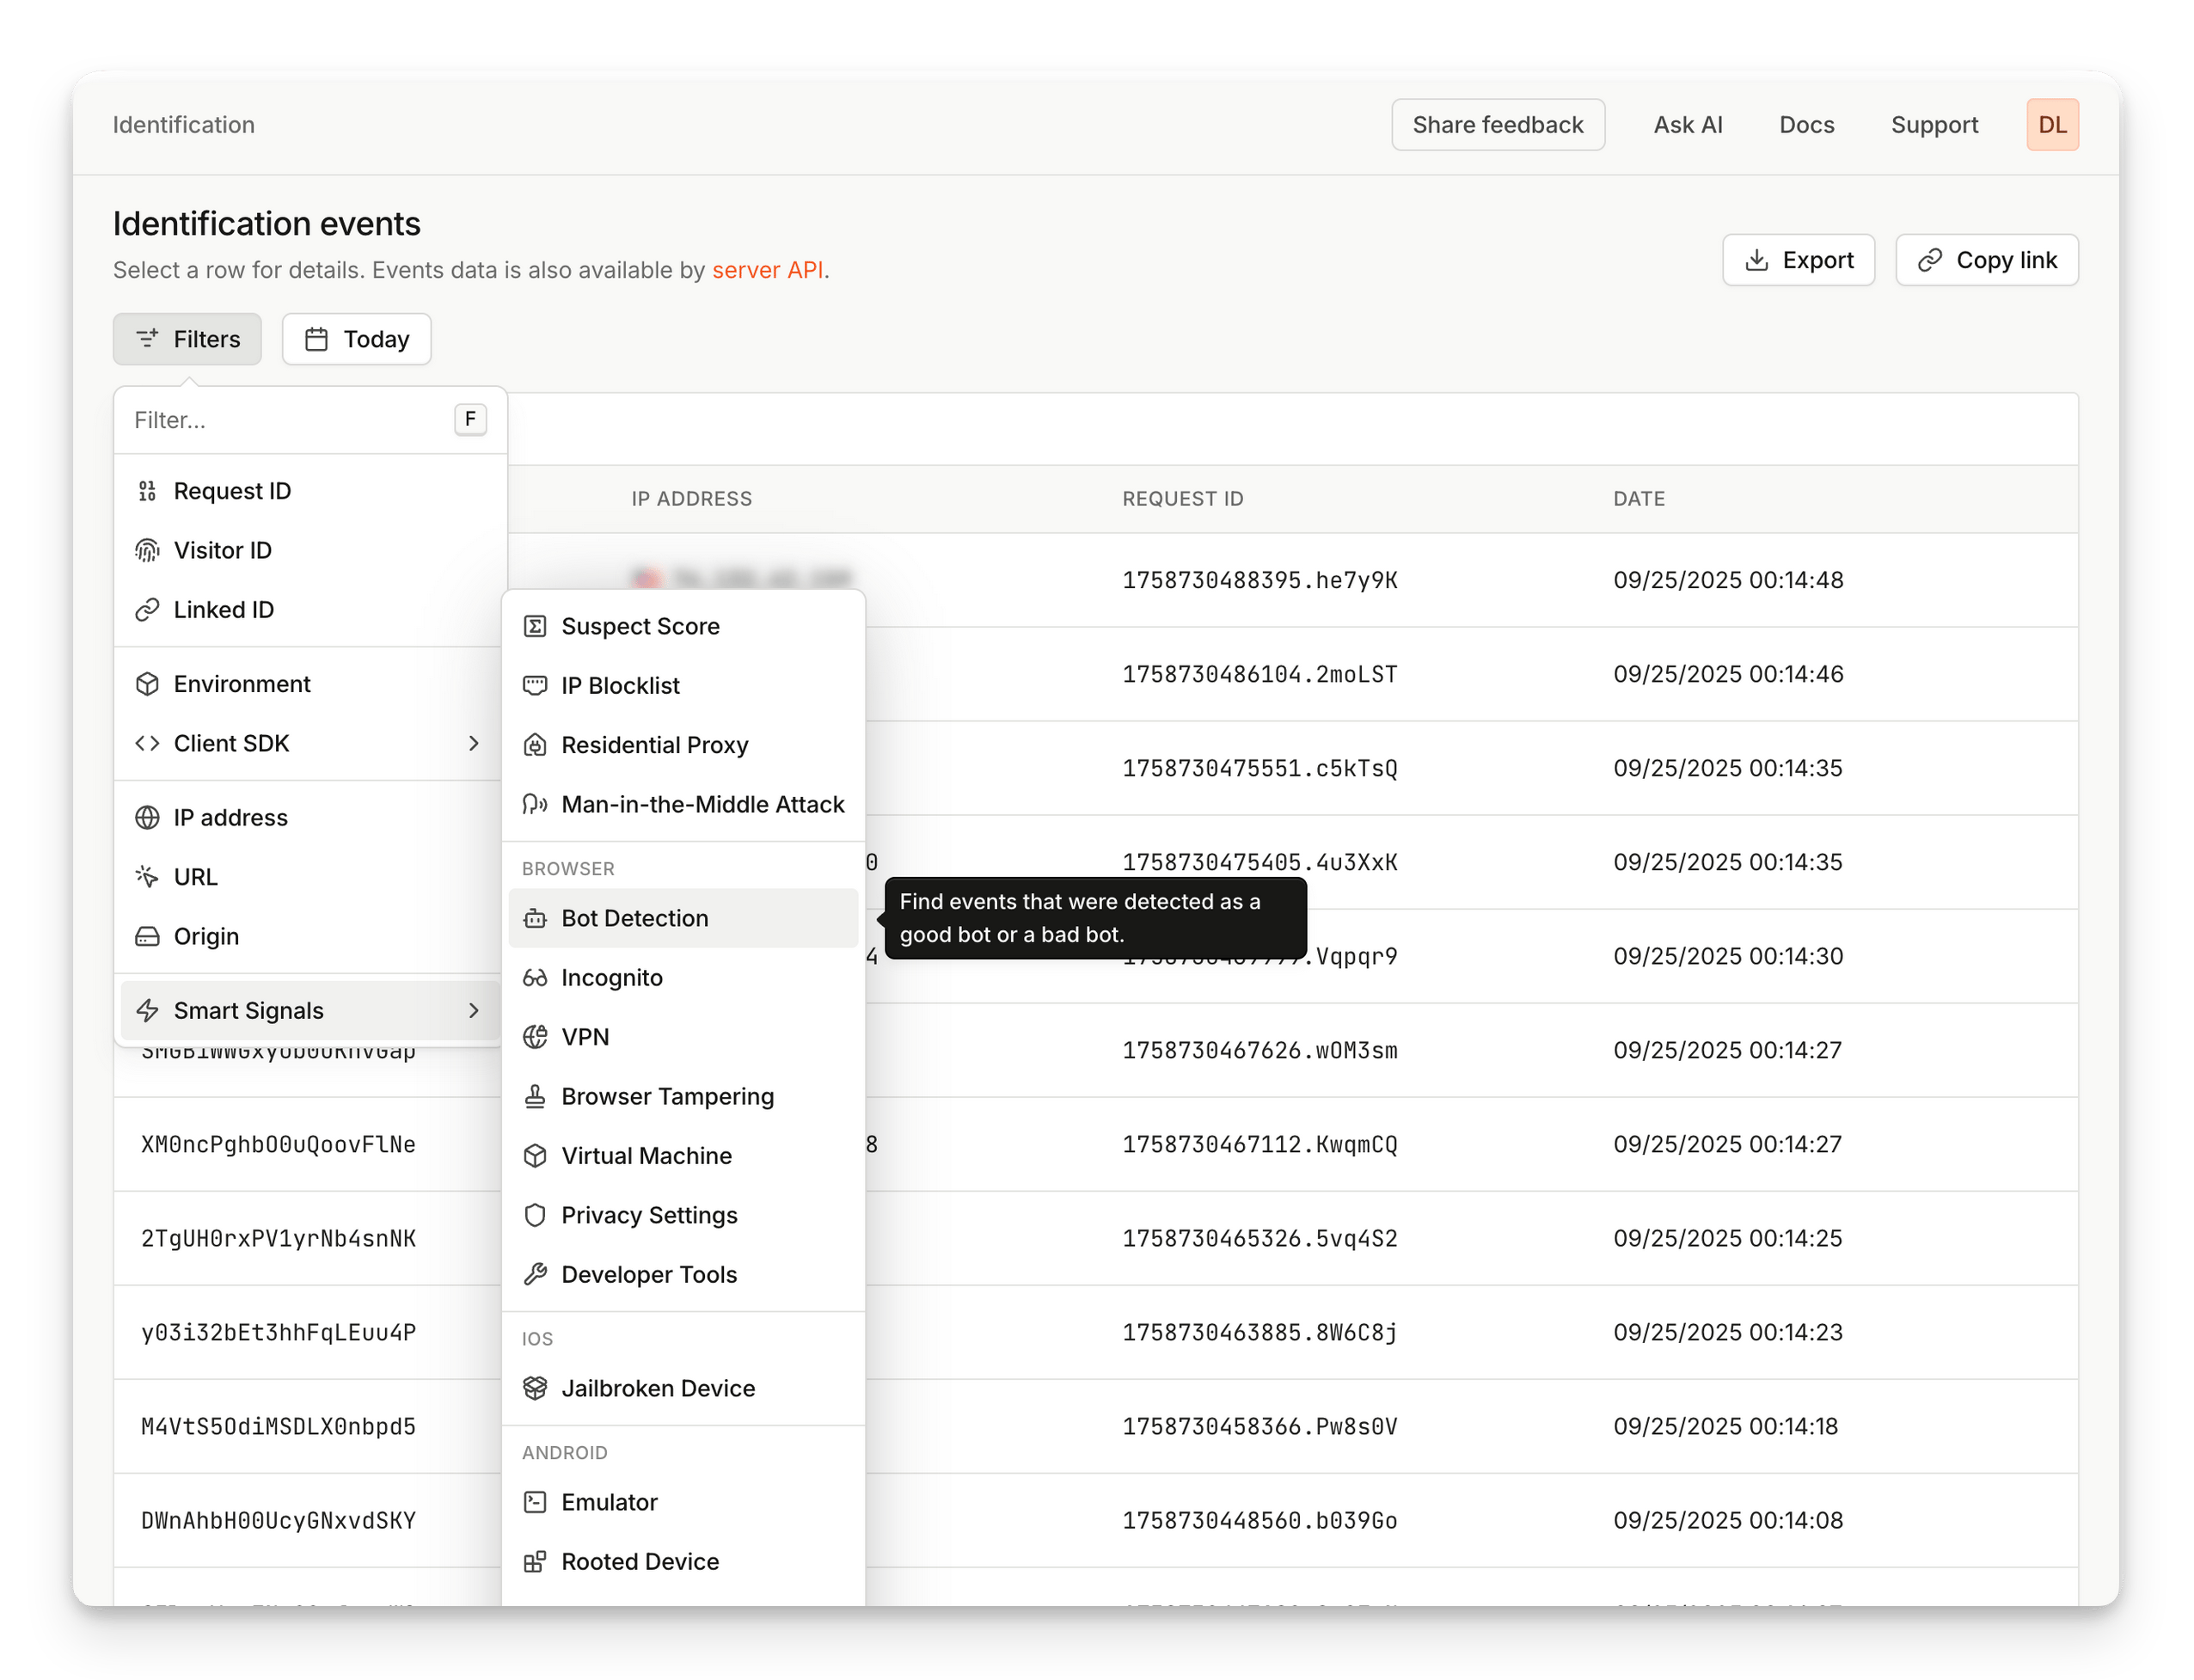
The page can be filtered by a very large number of available filters.
Show identification filters
Filter
Description
Event ID
Navigate to an event with specific ID
Visitor ID
Find events reported with a specific visitor ID
Linked ID
Find events reported with a specific linked ID
Environment
Find events associated with a specific environment
Client SDK
Find events reported from a specific SDK platform or version
IP address
Find events coming from a specific IP address, or an IP address matching a CIDR notation
URL
Find events reported from the specific URL or mobile app package identifier
0rigin
Find events reported from a specific domain or mobile app package identifier
Show Smart Signal filters
Smart Signal filter
Description
Suspect score
Find events with a suspect score greater than provided value
IP blocklist
Find events coming from IP addresses that were found in blocklists
Residential proxy
Find events coming from IP addresses that were detected as residential proxy
Man-in-the-middle attack
Find events where a request to Fingerprint was intercepted and modified
Bot detection
Find events that were detected as bots - good bots or bad bots
Incognito
Find events where incognito (or private mode) was detected
VPN
Find events that were reported behind a VPN
Browser tampering
Find events where browser tampering was detected
Virtual machine
Find events where the browser was detected as running inside a virtual machine
Privacy settings
Find events where the browser has privacy settings turned on
Developer tools
Find events where developer tools were open in the browser
Jailbroken device
Find events coming from a jailbroken iOS device
Emulator
Find events coming from an Android emulator
Rooted device
Find events coming from a rooted Android device
Cloned app
Find events coming from a cloned app
Frida
Find events coming from an app modified by a Frida toolkit
Location spoofing
Find events coming from a mobile device where location was spoofed
You can view identification events for up to the past 3 months.
Clicking on an event on the Identification page opens the Event Details view, which provides thorough information about that specific request.
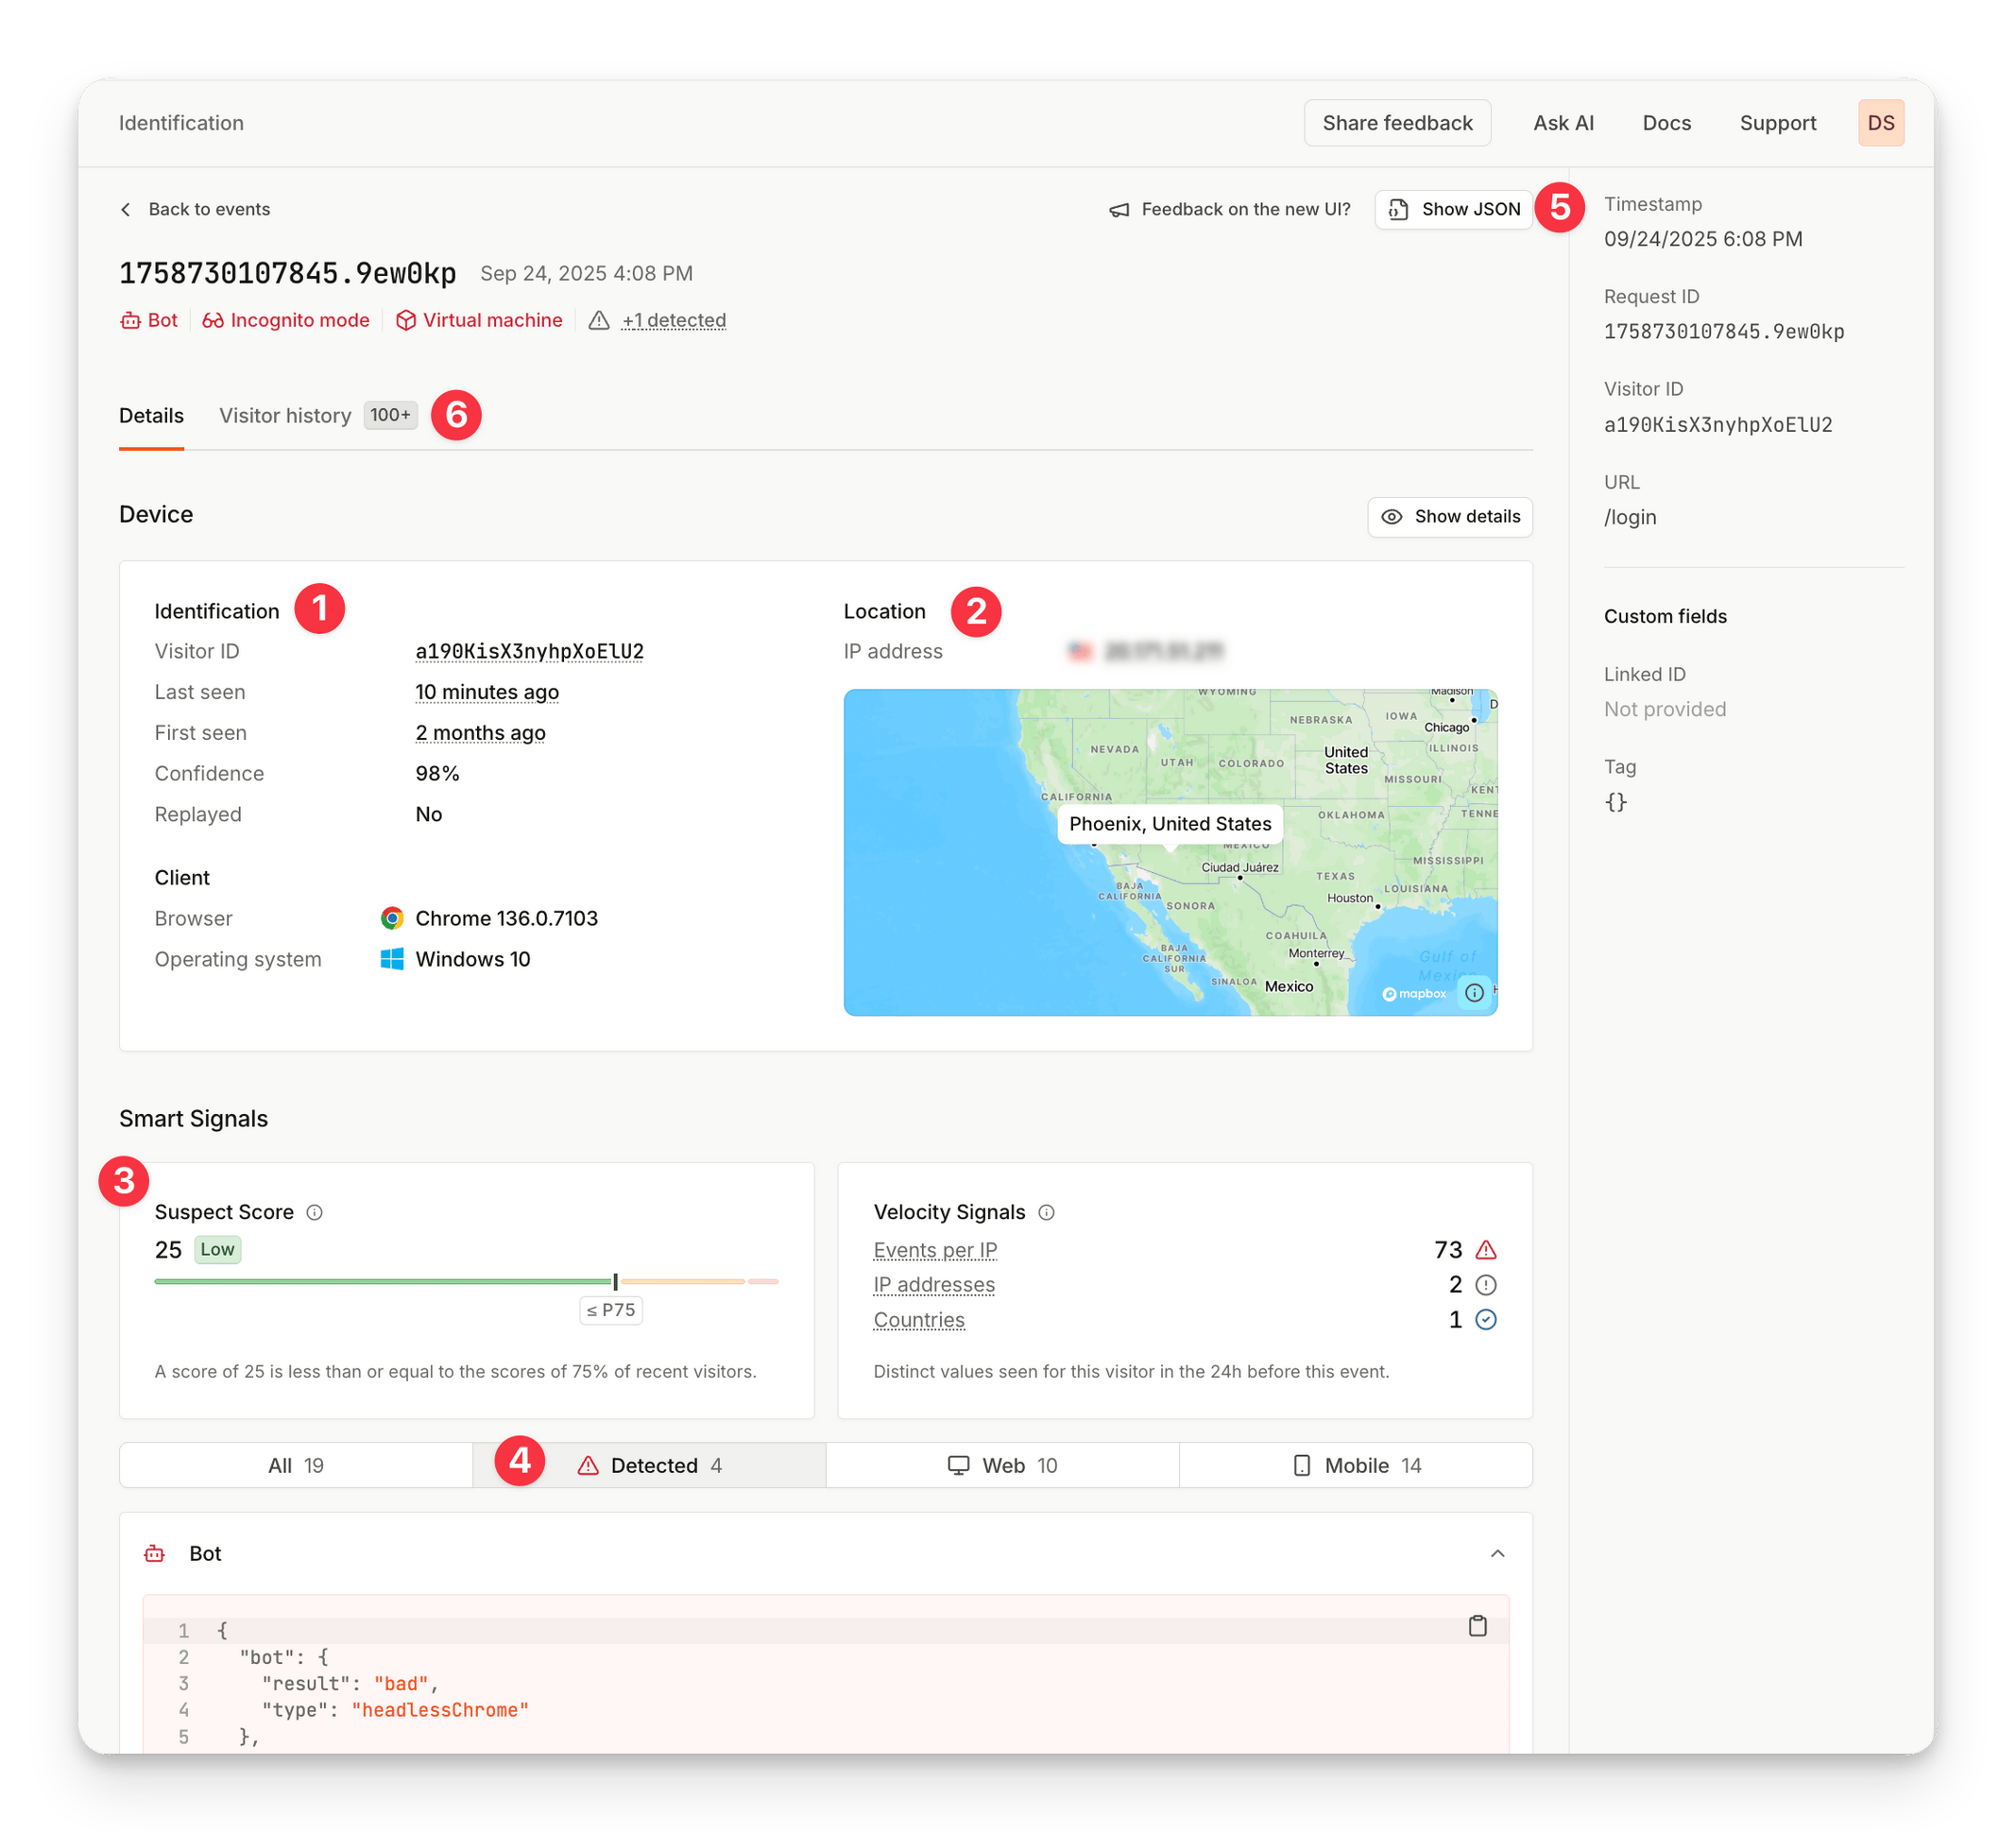
On the page you can find:
Device and visitor information: basic details about the device, client, browser, operating system, and Visitor ID
Location: includes the IP address and a visual map of the approximate location
Suspect Score: displays the score and indicates if it is considered low, medium, or high compared to recent traffic
Smart Signal details: details for all detected Smart Signals, including velocity signals
JSON view: explore the entire event by looking through the JSON payload
Visitor history: allows you to see all events detected from that single Visitor ID, which is a convenient way to find recurring patterns or similar events
The Smart Signals page focuses on providing statistics for Smart Signals, which are identifiers that give you actionable device intelligence for browsers and devices interacting with your application.You can access the Smart Signals page by visiting Dashboard > Smart Signals.
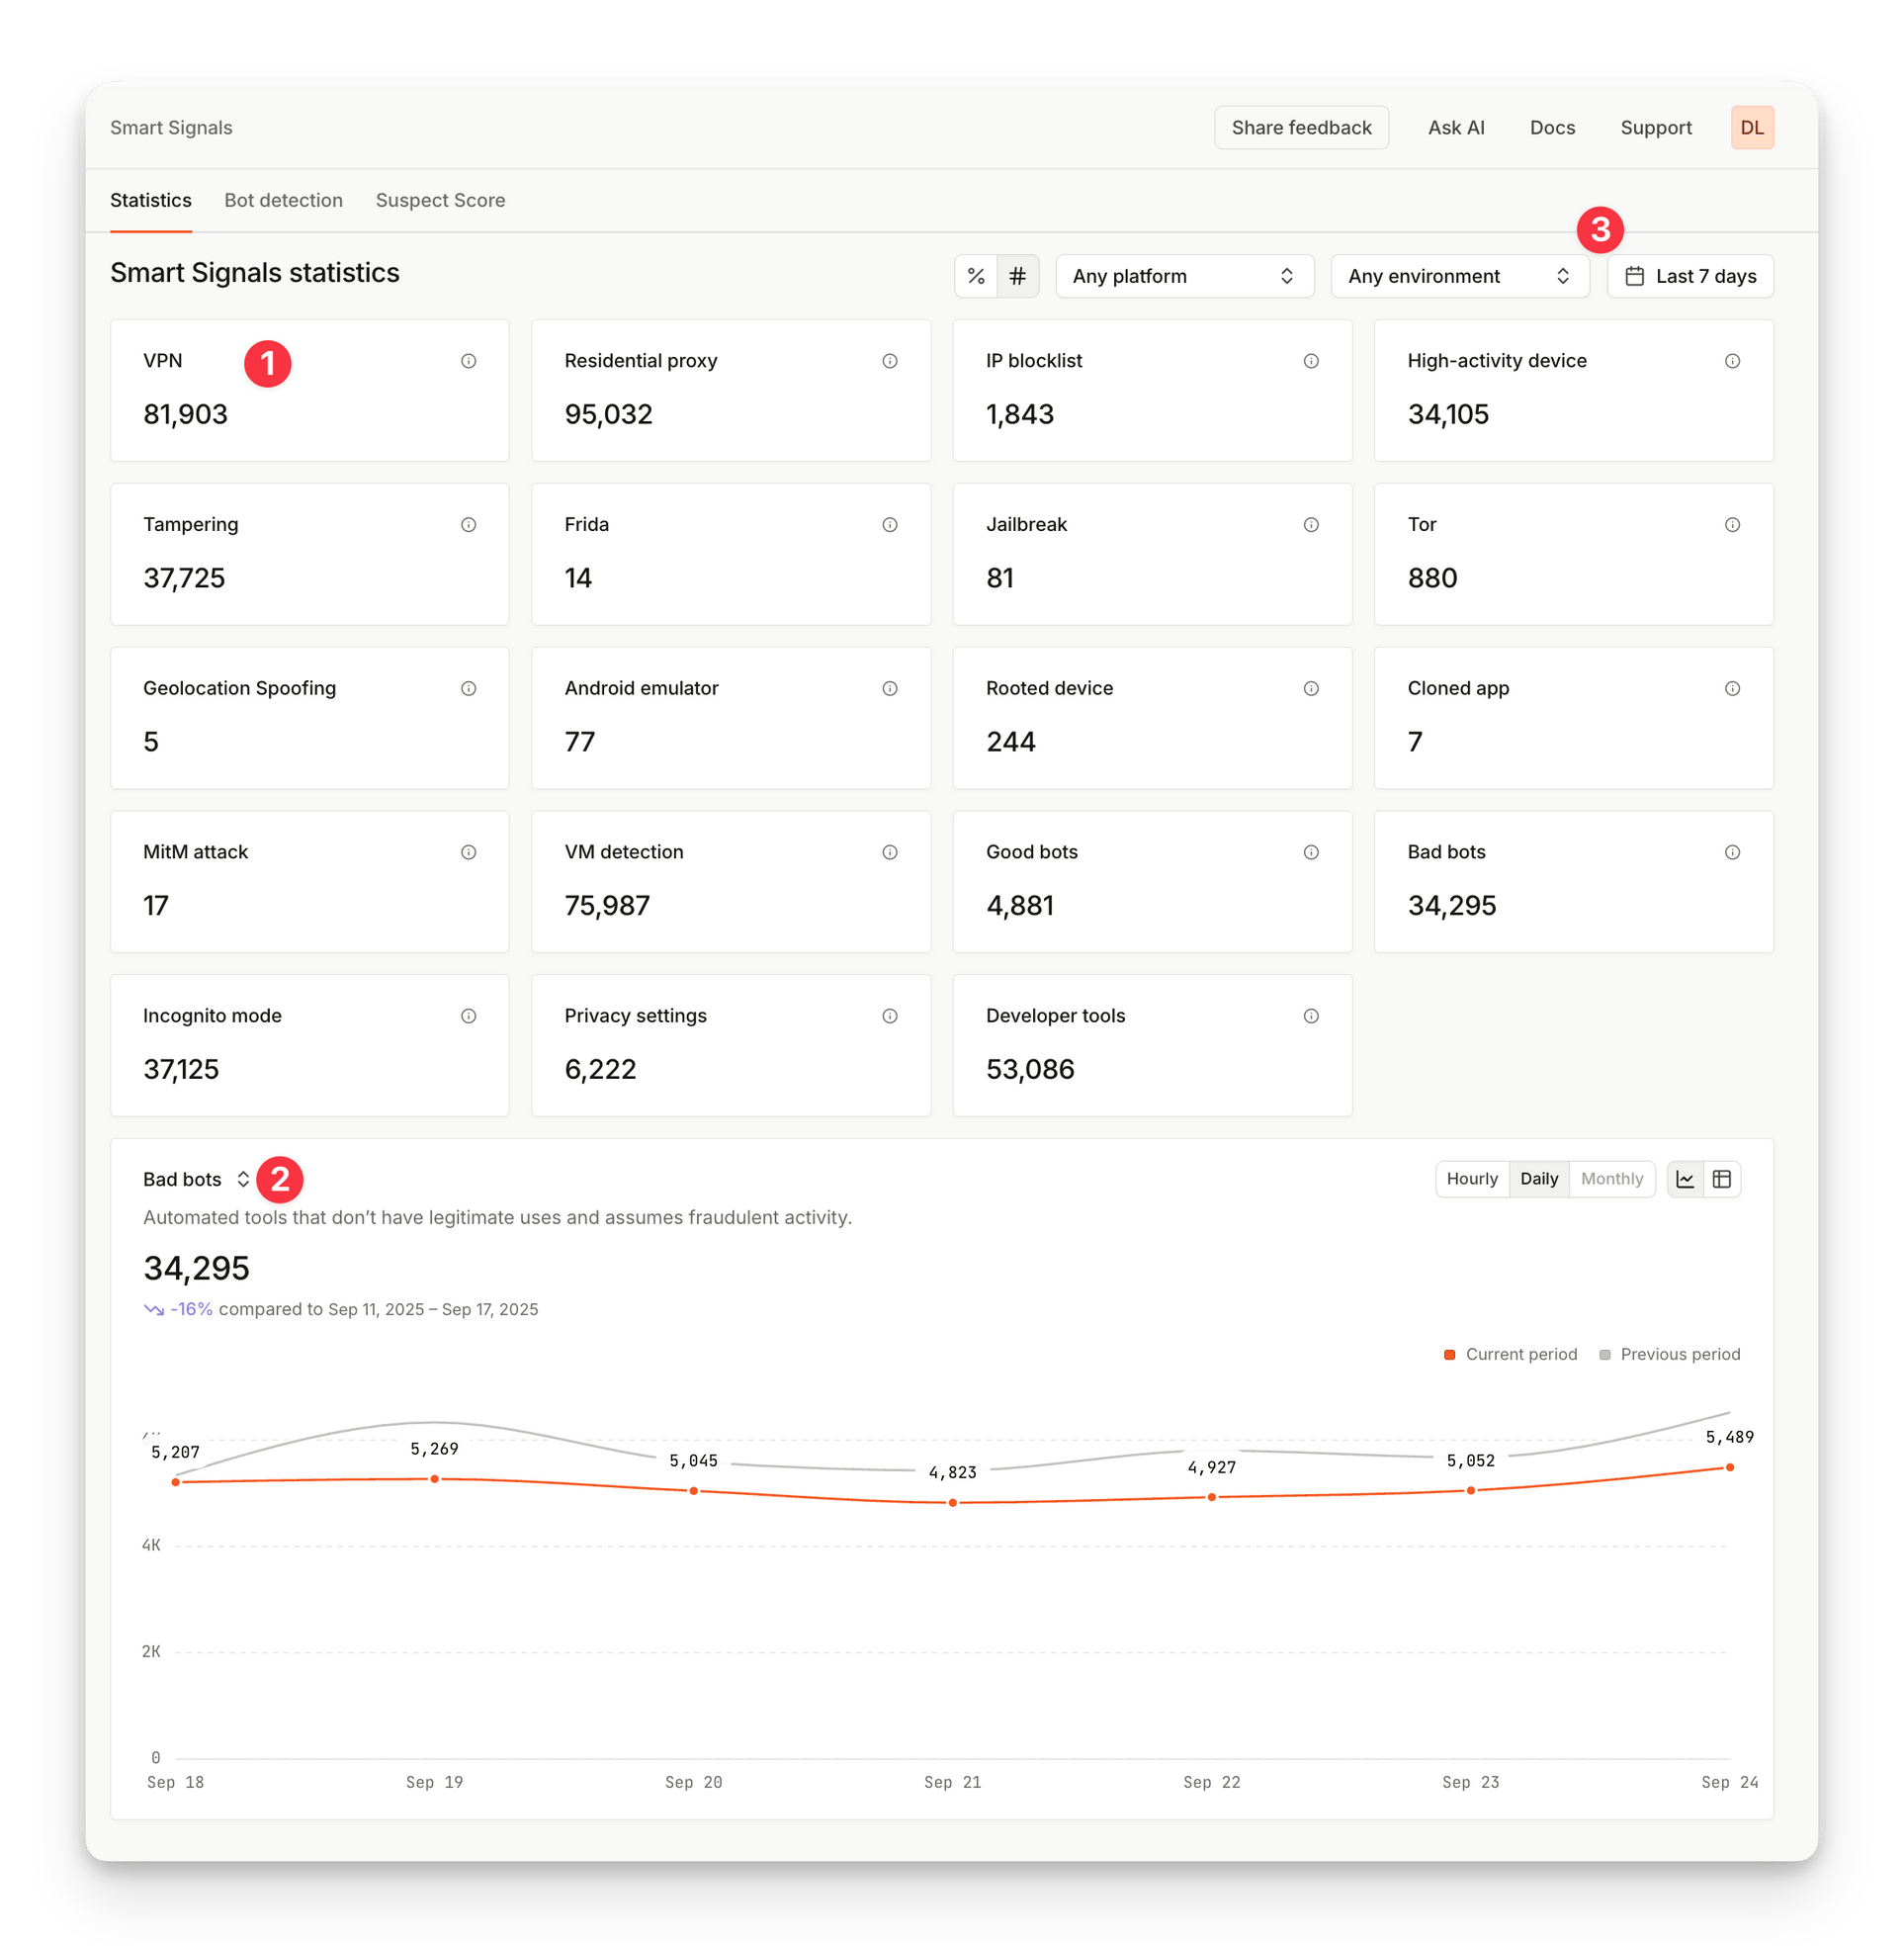
The page features a list of Smart Signals (1) and the number of events where each signal was detected for the selected time period.On the timeline chart (2), you can plot the selected signal over time, allowing you to compare the trend with previous period.This page also includes a date range filter, and an environment filter (3).Bot DetectionBy visiting the Bot Detection tab, you can gather more detailed information about detected bots - see the numbers of detected bad or good bots, their trends on the timeline chart, and inspect event details.Learn more about bot detection.
On the Identification page, you can export identification events into a CSV file for use in your own analysis, or integration with external fraud prevention systems.To get CSV export of your data, visit Dashboard > Identification, and click on Export (1).
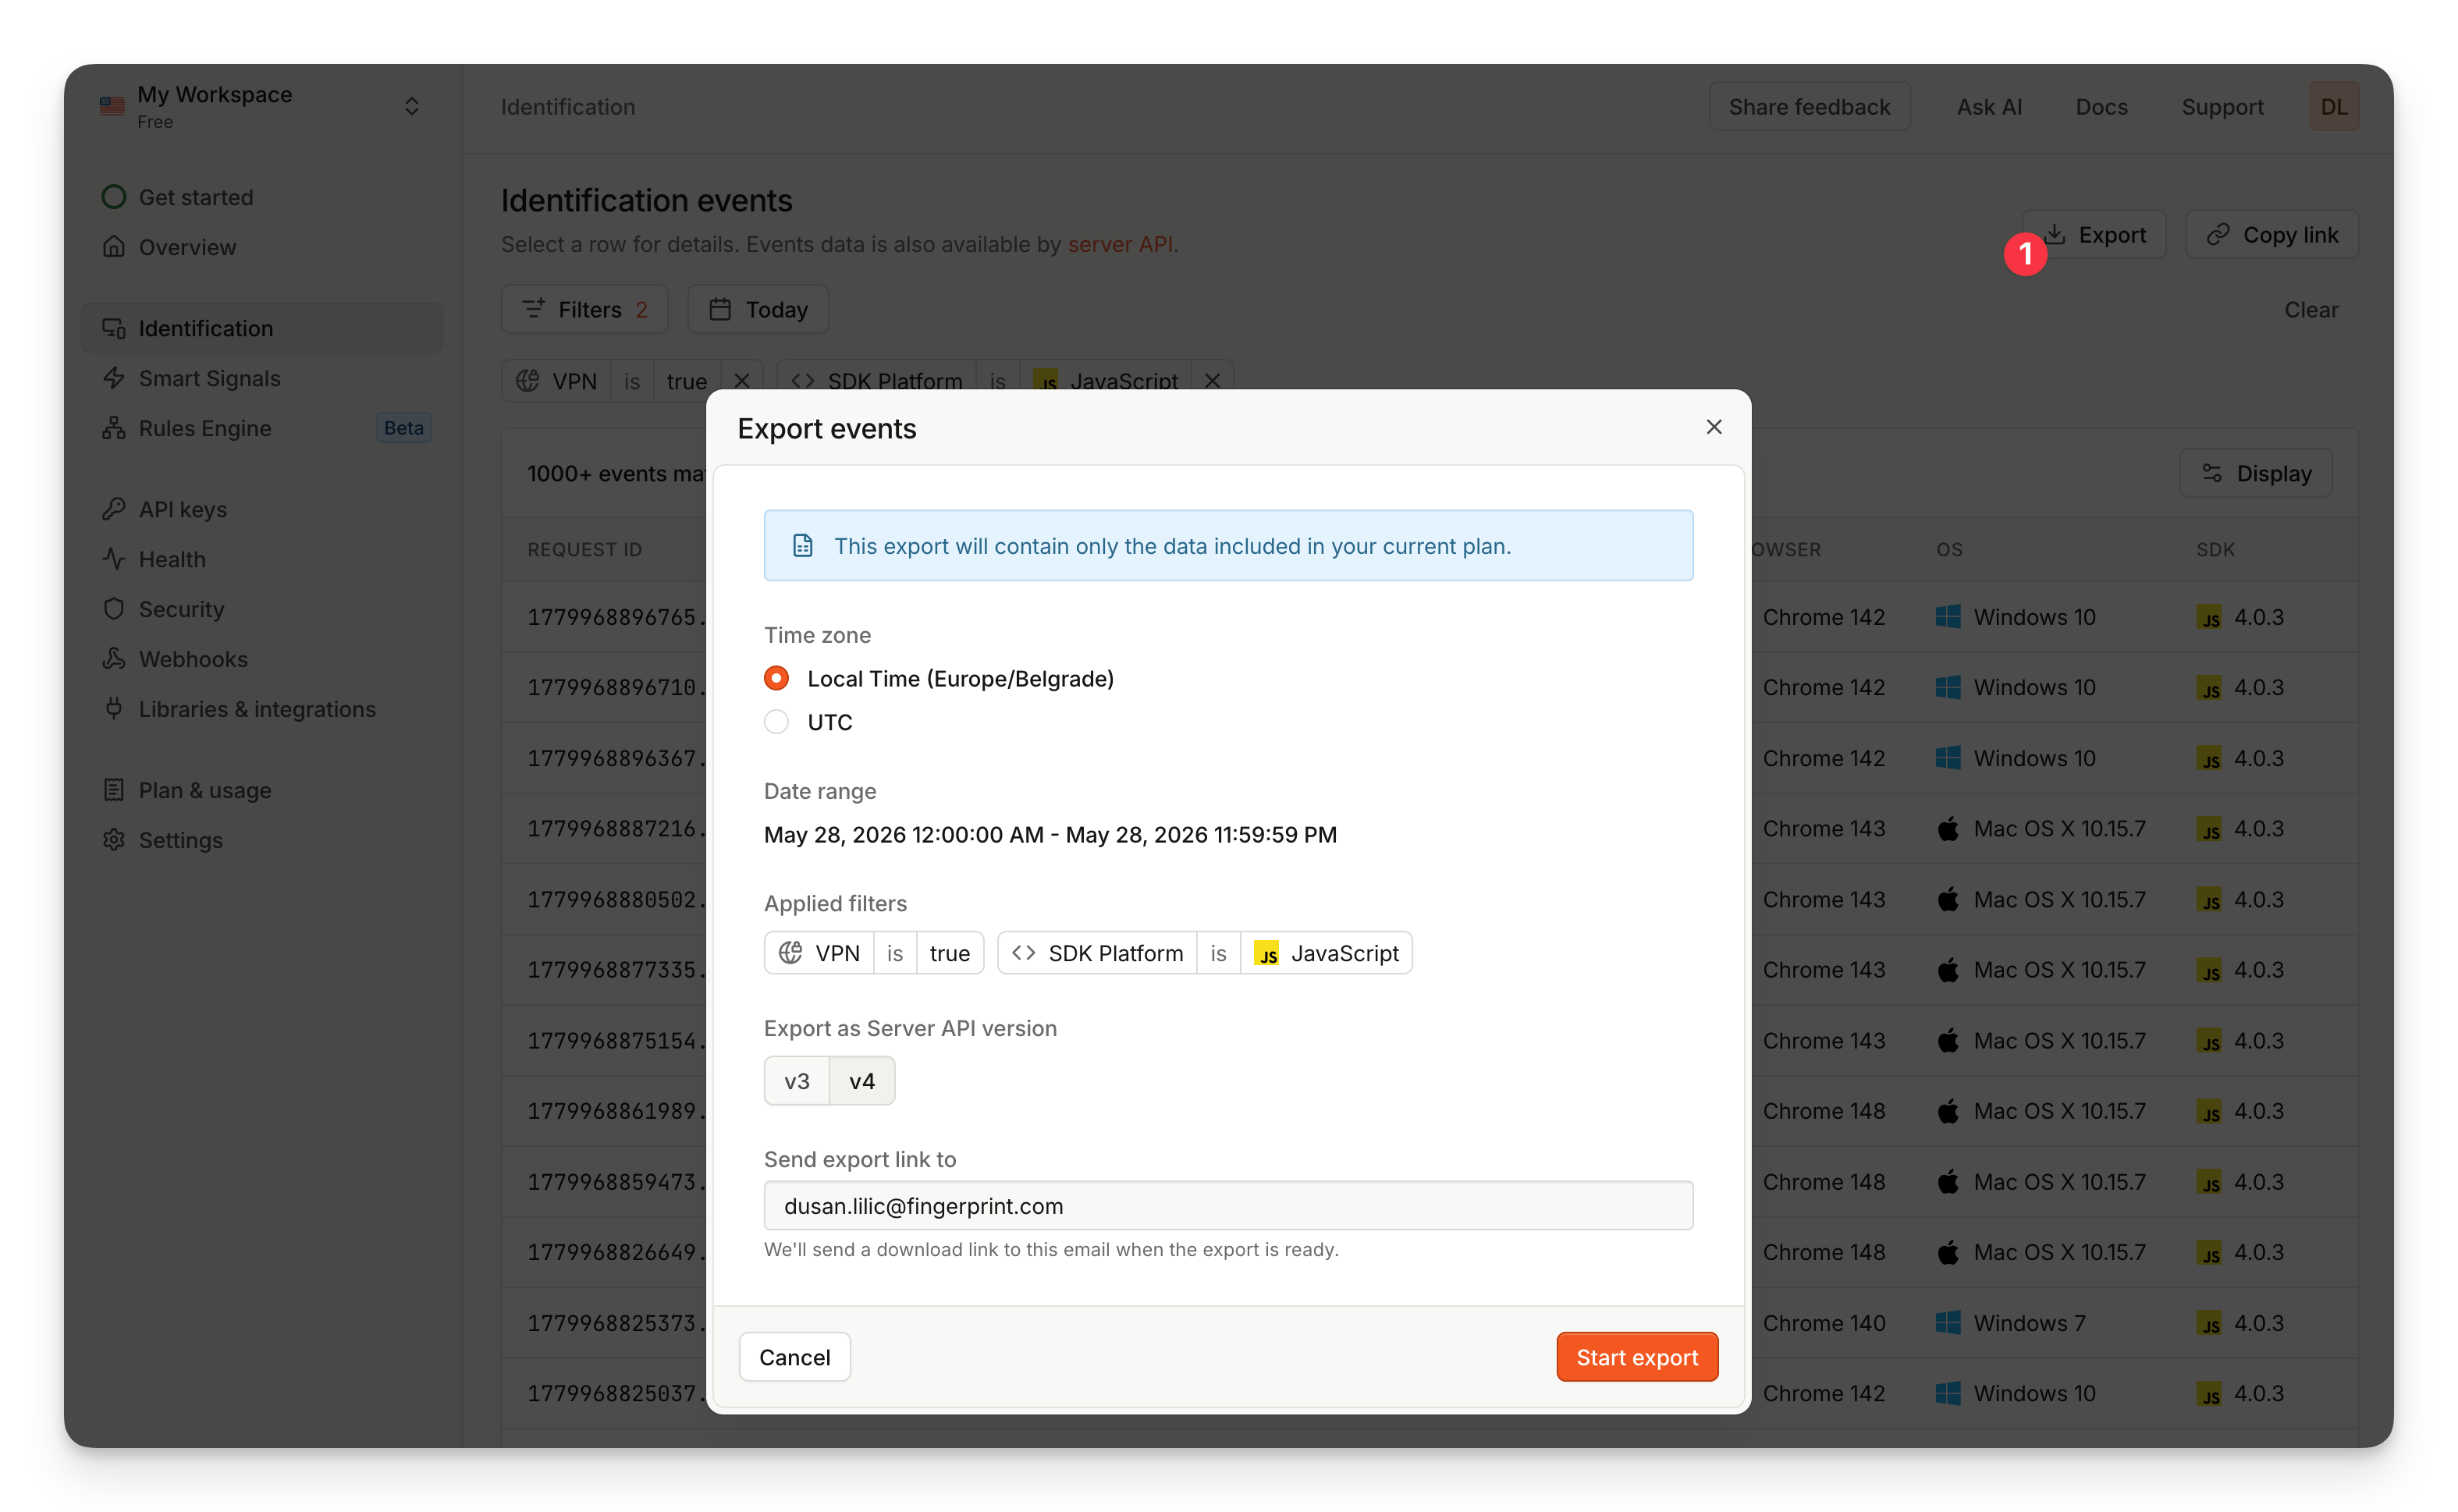
You can filter up to 3 months of data, and any applied filters will also apply on the CSV file. The data provided in the CSV matches the data from the Server API payload, and available columns are determined by your billing plan.