> ## Documentation Index
> Fetch the complete documentation index at: https://docs.fingerprint.com/llms.txt
> Use this file to discover all available pages before exploring further.
# Analytics
## Overview Page
The Overview page serves as the homepage for the Dashboard, displaying key insights and metrics at a glance. The page features a row of selected key metrics, a timeline chart, and distribution lists. The page also features a date range filter, and an environment filter.
You can access the Overview page by visiting **Dashboard** > [**Overview**](https://dashboard.fingerprint.com/overview).
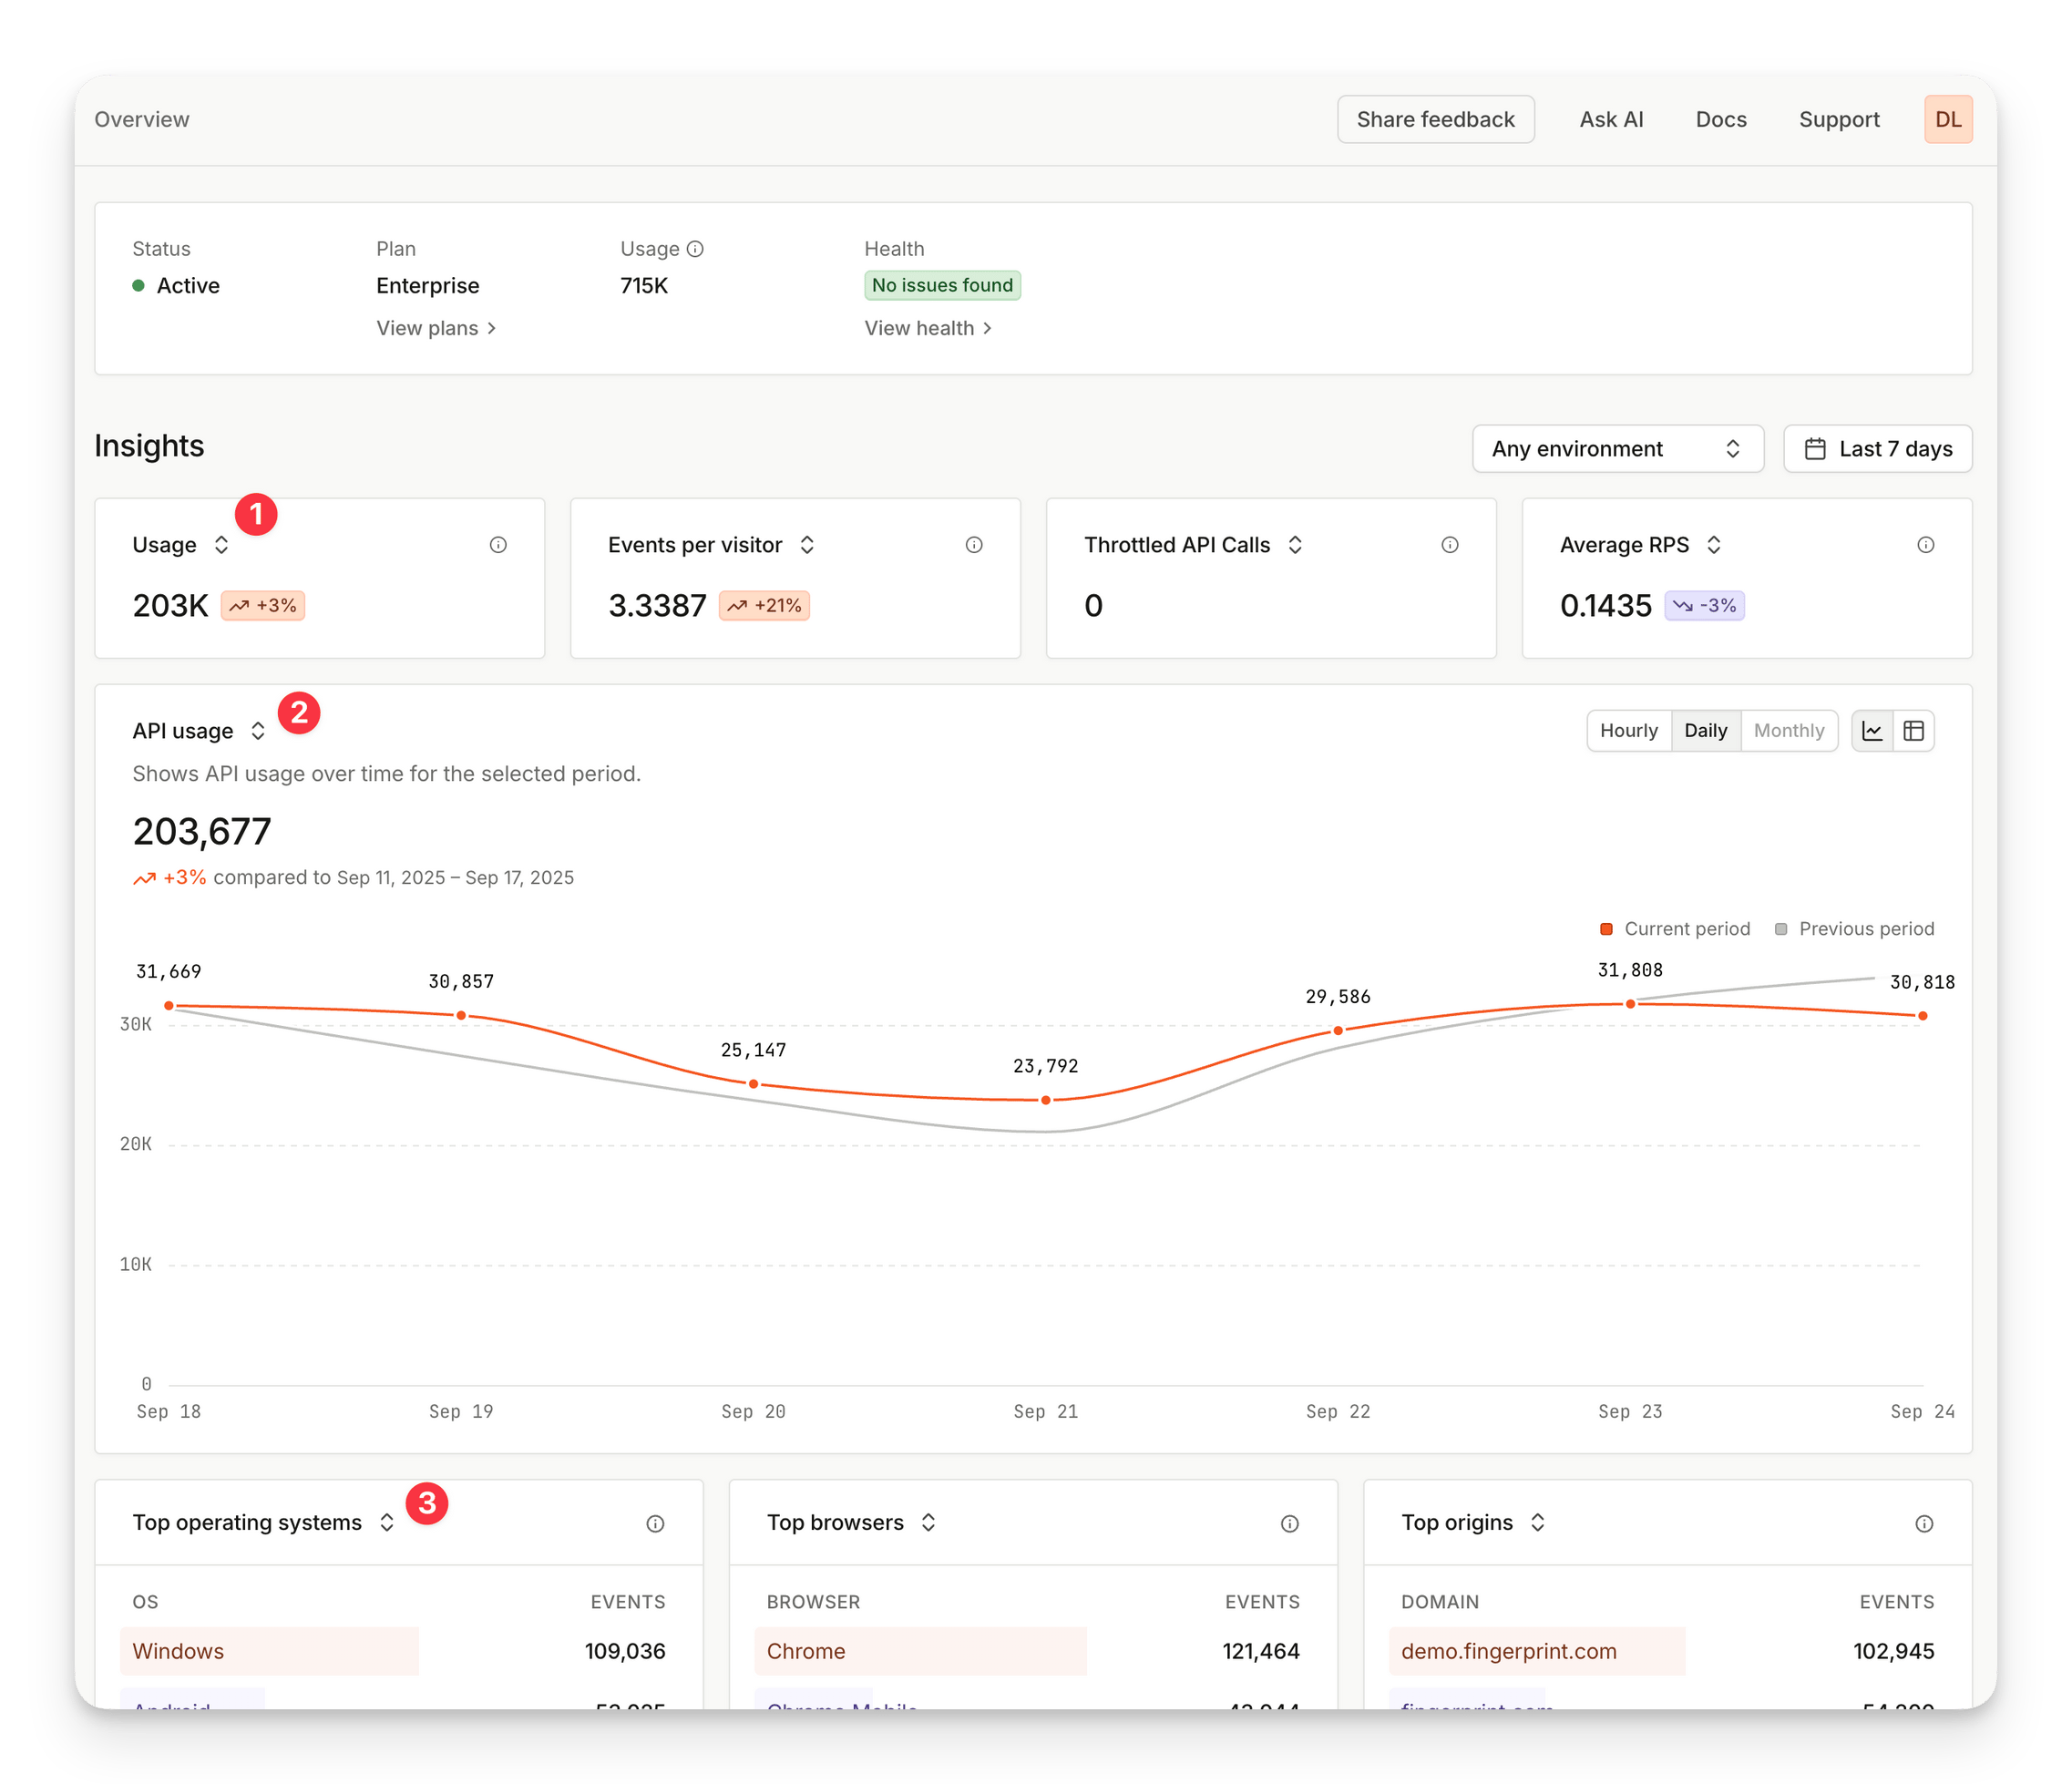 The **key metrics** (1) provide you with information and insights about your integration at a glance.
| Metric | Description |
| ------------------------------------- | ---------------------------------------------------------------------------------------------------------------------------------------------------------- |
| **API usage** | Number of identification requests made in the selected period |
| **Number of unique visitors** | Number of distinct visitor IDs seen in the selected period |
| **Events per visitor ratio** | Average number of identification events for every uniquely identified visitor |
| **Number of restricted API calls** | Number of API calls that were restricted due to request filtering rules, exceeding limits on your environments, or exceeding limits on your workspace plan |
| **Number of throttled API calls** | Number of API calls that went over the RPS limit and were throttled |
| **Average requests per second (RPS)** | Rolling average number of requests per second in the selected period |
| **Peak requests per second (RPS)** | Peak number of requests per second in 5-minute window |
The **timeline chart** (2) provides a view into key metrics over time (hourly, daily, monthly), and shows comparison to the previous period.
| Timeline view | Description |
| ----------------------------- | -------------------------------------------------------------------------------------------------- |
| **API usage** | Displays a timeline chart of API usage, comparing currently selected period to the previous period |
| **Events per visitor** | Shows the timeline chart of the ratio of identification requests per unique visitor ID |
| **Failed API calls** | Shows the number of throttled and restricted API calls for the selected period |
| **Requests per second (RPS)** | Shows API usage bandwidth as average and peak requests per second, for the selected period |
The **distribution lists** (3) display top lists of observed entities sorted by number of events associated with each entity.
| Distribution list | Description |
| ------------------------- | ------------------------------------------------ |
| **Top browsers** | List of web browsers |
| **Top client types** | List of client SDK platforms |
| **Top client versions** | List of specific client SDK versions |
| **Top countries** | List of originating countries |
| **Top operating systems** | List of originating operating systems |
| **Top origins** | List of origin domains or mobile app identifiers |
| **Top URLs** | List of specific URLs where events were recorded |
You can view statistics for up to the past 12 months.
## Identification Events
The Identification page lists all recent identification events, allows you to find specific events, and dive deep into their details. The page also features a date range filter, and a wide array of other filtering options.
You can access the Identification page by visiting **Dashboard** > [**Identification**](https://dashboard.fingerprint.com/events).
The **key metrics** (1) provide you with information and insights about your integration at a glance.
| Metric | Description |
| ------------------------------------- | ---------------------------------------------------------------------------------------------------------------------------------------------------------- |
| **API usage** | Number of identification requests made in the selected period |
| **Number of unique visitors** | Number of distinct visitor IDs seen in the selected period |
| **Events per visitor ratio** | Average number of identification events for every uniquely identified visitor |
| **Number of restricted API calls** | Number of API calls that were restricted due to request filtering rules, exceeding limits on your environments, or exceeding limits on your workspace plan |
| **Number of throttled API calls** | Number of API calls that went over the RPS limit and were throttled |
| **Average requests per second (RPS)** | Rolling average number of requests per second in the selected period |
| **Peak requests per second (RPS)** | Peak number of requests per second in 5-minute window |
The **timeline chart** (2) provides a view into key metrics over time (hourly, daily, monthly), and shows comparison to the previous period.
| Timeline view | Description |
| ----------------------------- | -------------------------------------------------------------------------------------------------- |
| **API usage** | Displays a timeline chart of API usage, comparing currently selected period to the previous period |
| **Events per visitor** | Shows the timeline chart of the ratio of identification requests per unique visitor ID |
| **Failed API calls** | Shows the number of throttled and restricted API calls for the selected period |
| **Requests per second (RPS)** | Shows API usage bandwidth as average and peak requests per second, for the selected period |
The **distribution lists** (3) display top lists of observed entities sorted by number of events associated with each entity.
| Distribution list | Description |
| ------------------------- | ------------------------------------------------ |
| **Top browsers** | List of web browsers |
| **Top client types** | List of client SDK platforms |
| **Top client versions** | List of specific client SDK versions |
| **Top countries** | List of originating countries |
| **Top operating systems** | List of originating operating systems |
| **Top origins** | List of origin domains or mobile app identifiers |
| **Top URLs** | List of specific URLs where events were recorded |
You can view statistics for up to the past 12 months.
## Identification Events
The Identification page lists all recent identification events, allows you to find specific events, and dive deep into their details. The page also features a date range filter, and a wide array of other filtering options.
You can access the Identification page by visiting **Dashboard** > [**Identification**](https://dashboard.fingerprint.com/events).
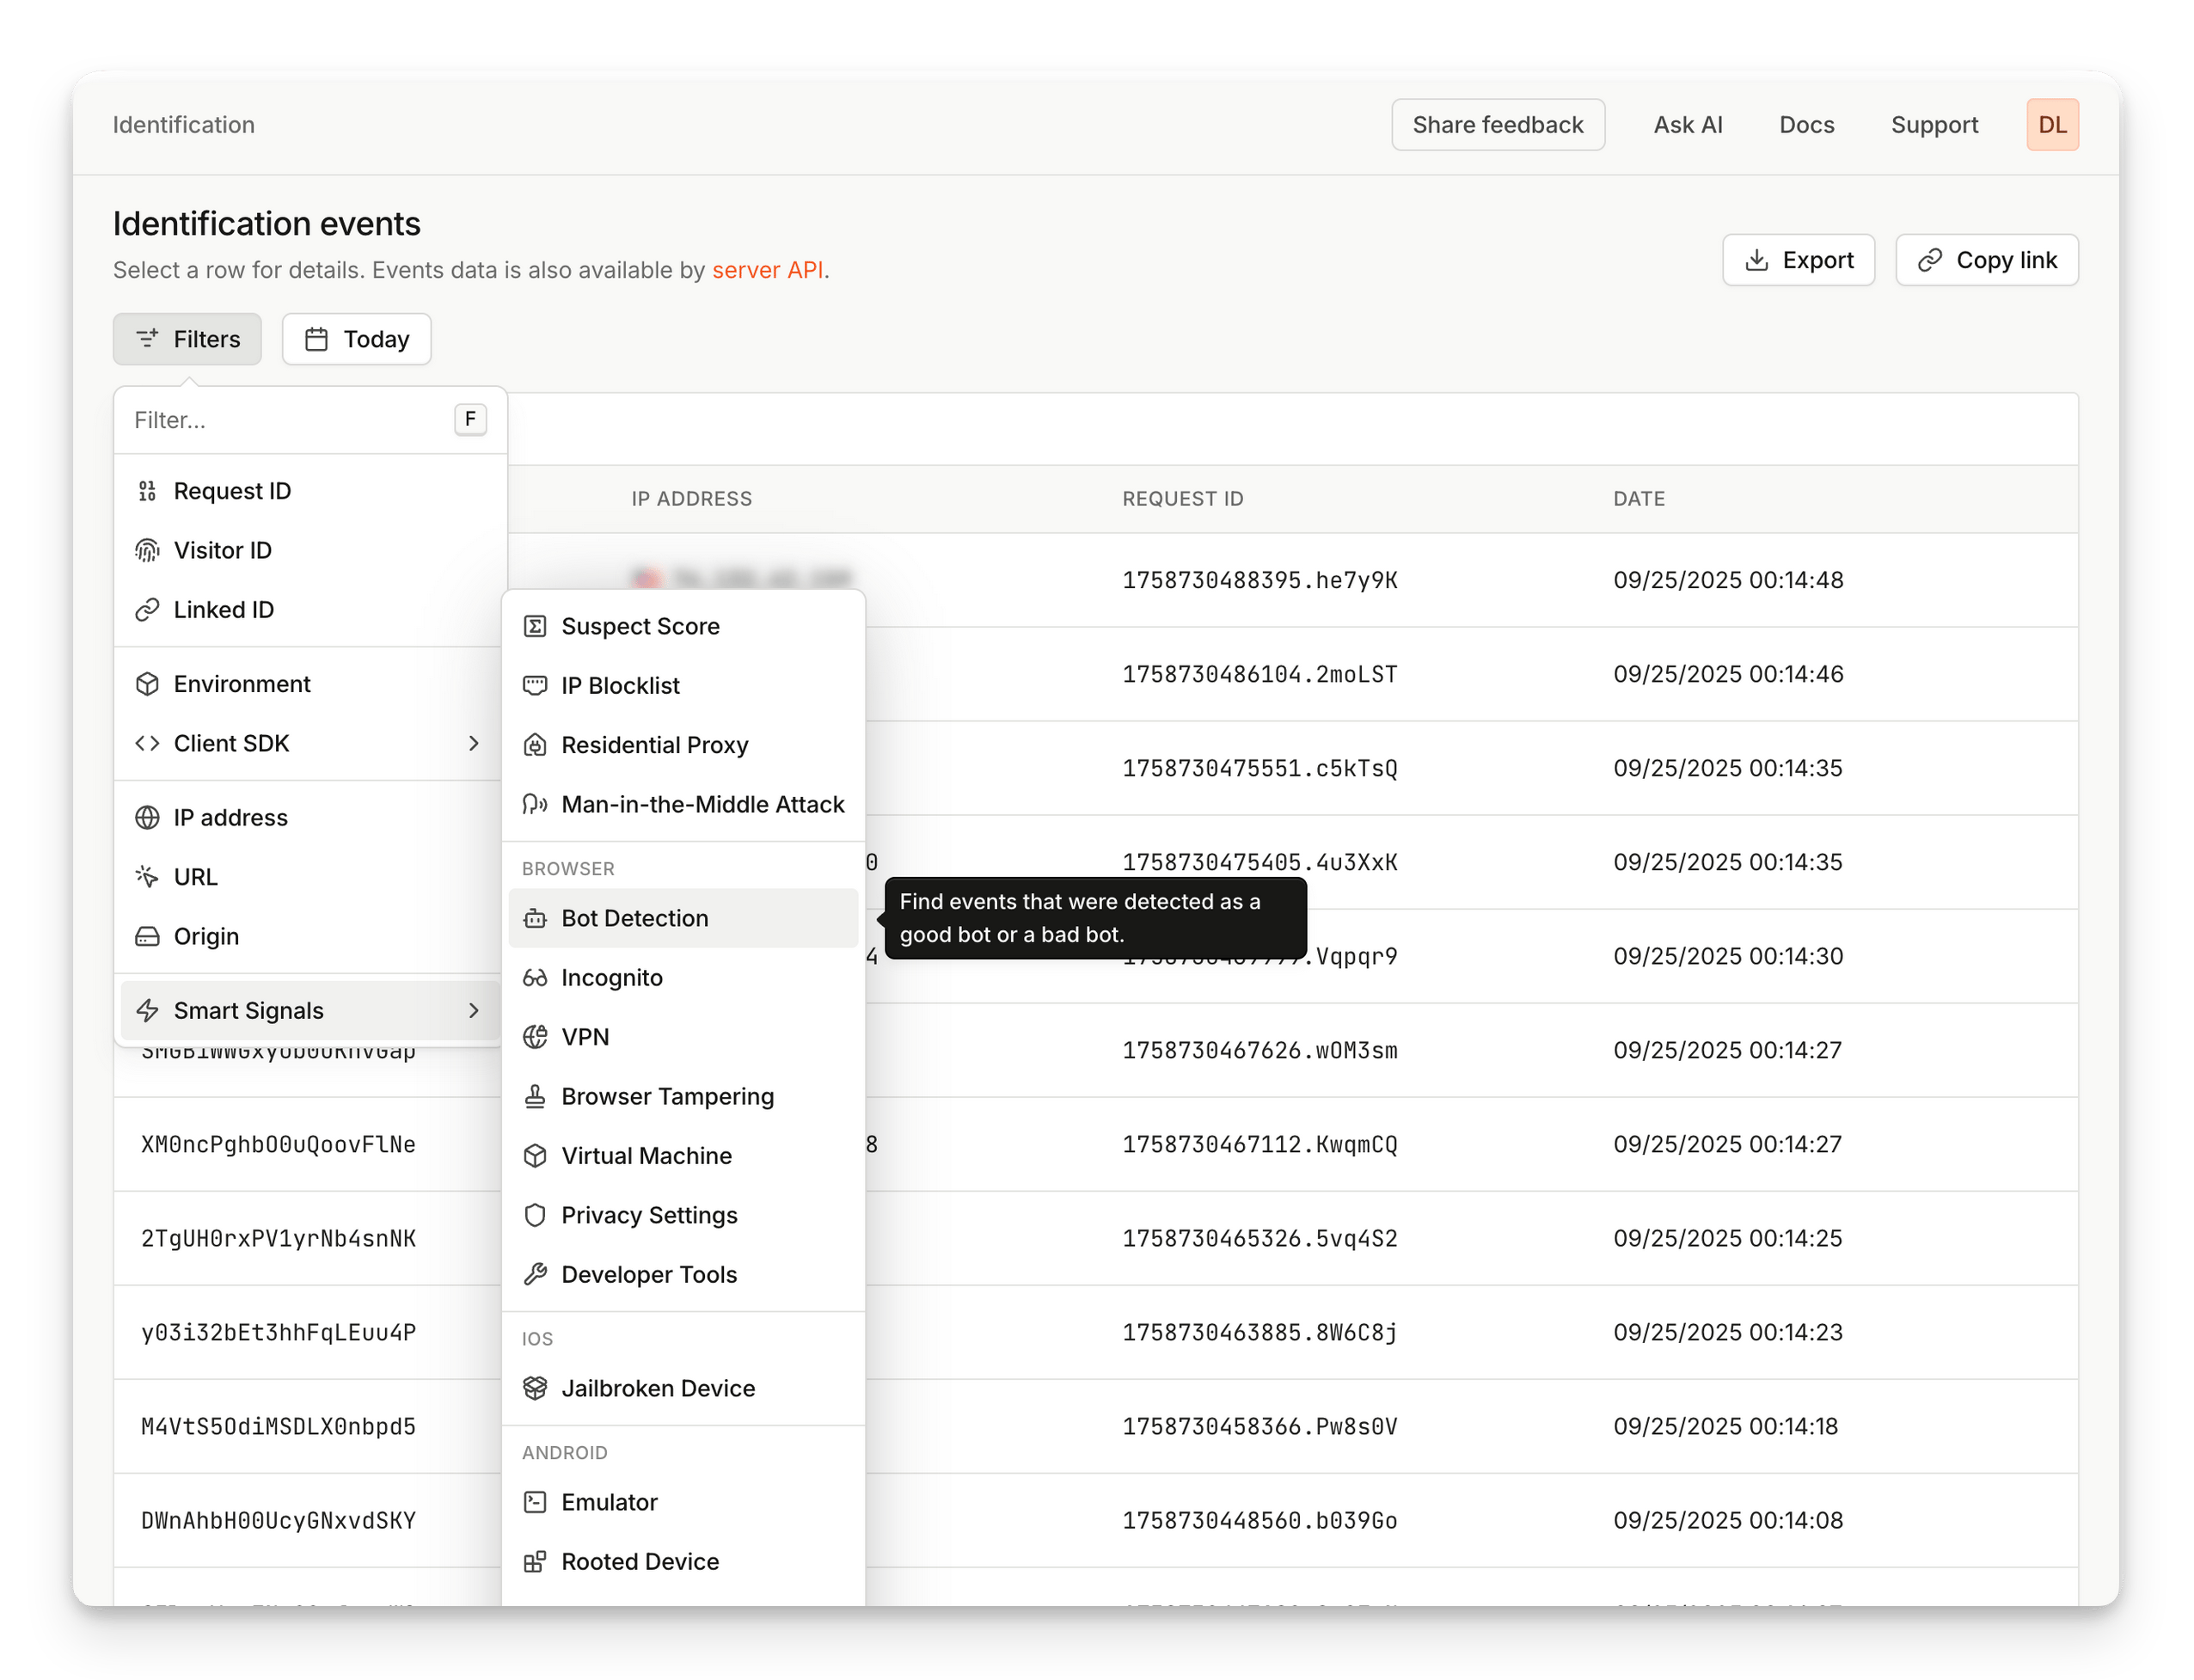 The page can be filtered by a very large number of **available filters**.
| Filter | Description |
| --------------- | ---------------------------------------------------------------------------------------- |
| **Event ID** | Navigate to an event with specific ID |
| **Visitor ID** | Find events reported with a specific visitor ID |
| **Linked ID** | Find events reported with a specific linked ID |
| **Environment** | Find events associated with a specific environment |
| **Client SDK** | Find events reported from a specific SDK platform or version |
| **IP address** | Find events coming from a specific IP address, or an IP address matching a CIDR notation |
| **URL** | Find events reported from the specific URL or mobile app package identifier |
| **0rigin** | Find events reported from a specific domain or mobile app package identifier |
| Smart Signal filter | Description |
| ---------------------------- | ------------------------------------------------------------------------------ |
| **Suspect score** | Find events with a suspect score greater than provided value |
| **IP blocklist** | Find events coming from IP addresses that were found in blocklists |
| **Residential proxy** | Find events coming from IP addresses that were detected as residential proxy |
| **Man-in-the-middle attack** | Find events where a request to Fingerprint was intercepted and modified |
| **Bot detection** | Find events that were detected as bots - good bots or bad bots |
| **Incognito** | Find events where incognito (or private mode) was detected |
| **VPN** | Find events that were reported behind a VPN |
| **Browser tampering** | Find events where browser tampering was detected |
| **Virtual machine** | Find events where the browser was detected as running inside a virtual machine |
| **Privacy settings** | Find events where the browser has privacy settings turned on |
| **Developer tools** | Find events where developer tools were open in the browser |
| **Jailbroken device** | Find events coming from a jailbroken iOS device |
| **Emulator** | Find events coming from an Android emulator |
| **Rooted device** | Find events coming from a rooted Android device |
| **Cloned app** | Find events coming from a cloned app |
| **Frida** | Find events coming from an app modified by a Frida toolkit |
| **Location spoofing** | Find events coming from a mobile device where location was spoofed |
You can view identification events for up to the past 3 months.
## Event details page
Clicking on an event on the Identification page opens the **Event Details** view, which provides thorough information about that specific request.
The page can be filtered by a very large number of **available filters**.
| Filter | Description |
| --------------- | ---------------------------------------------------------------------------------------- |
| **Event ID** | Navigate to an event with specific ID |
| **Visitor ID** | Find events reported with a specific visitor ID |
| **Linked ID** | Find events reported with a specific linked ID |
| **Environment** | Find events associated with a specific environment |
| **Client SDK** | Find events reported from a specific SDK platform or version |
| **IP address** | Find events coming from a specific IP address, or an IP address matching a CIDR notation |
| **URL** | Find events reported from the specific URL or mobile app package identifier |
| **0rigin** | Find events reported from a specific domain or mobile app package identifier |
| Smart Signal filter | Description |
| ---------------------------- | ------------------------------------------------------------------------------ |
| **Suspect score** | Find events with a suspect score greater than provided value |
| **IP blocklist** | Find events coming from IP addresses that were found in blocklists |
| **Residential proxy** | Find events coming from IP addresses that were detected as residential proxy |
| **Man-in-the-middle attack** | Find events where a request to Fingerprint was intercepted and modified |
| **Bot detection** | Find events that were detected as bots - good bots or bad bots |
| **Incognito** | Find events where incognito (or private mode) was detected |
| **VPN** | Find events that were reported behind a VPN |
| **Browser tampering** | Find events where browser tampering was detected |
| **Virtual machine** | Find events where the browser was detected as running inside a virtual machine |
| **Privacy settings** | Find events where the browser has privacy settings turned on |
| **Developer tools** | Find events where developer tools were open in the browser |
| **Jailbroken device** | Find events coming from a jailbroken iOS device |
| **Emulator** | Find events coming from an Android emulator |
| **Rooted device** | Find events coming from a rooted Android device |
| **Cloned app** | Find events coming from a cloned app |
| **Frida** | Find events coming from an app modified by a Frida toolkit |
| **Location spoofing** | Find events coming from a mobile device where location was spoofed |
You can view identification events for up to the past 3 months.
## Event details page
Clicking on an event on the Identification page opens the **Event Details** view, which provides thorough information about that specific request.
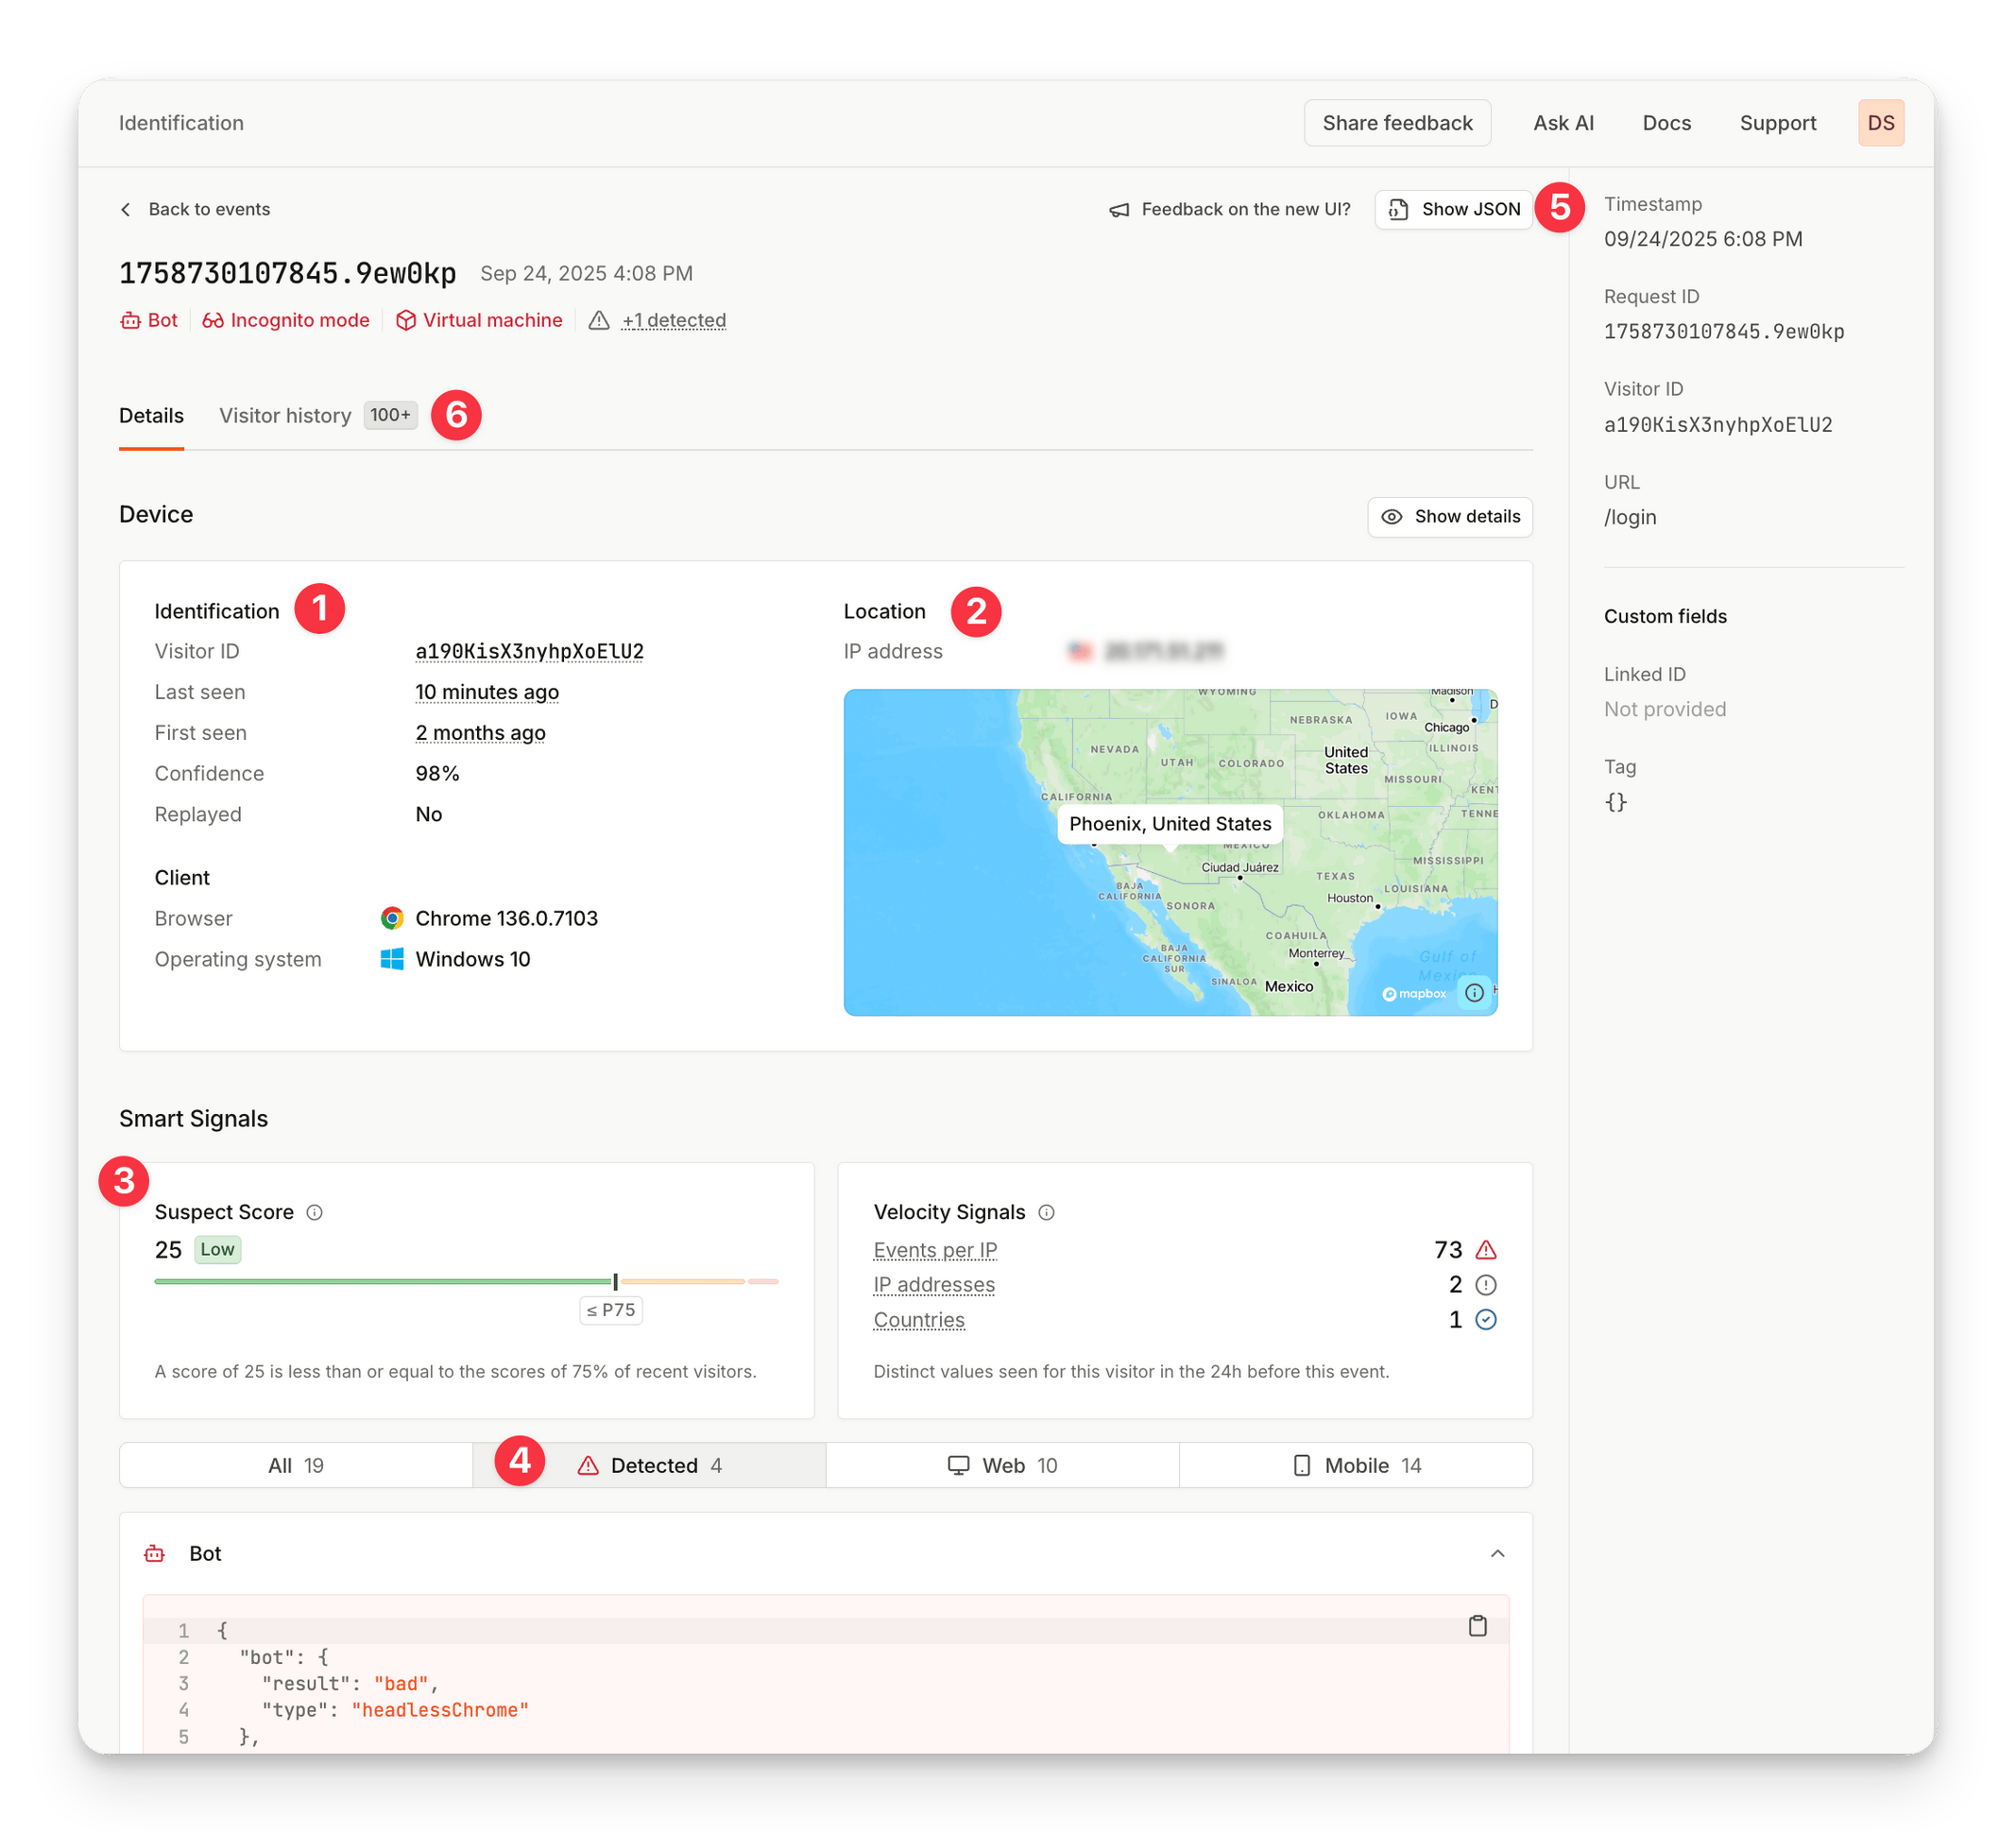 On the page you can find:
1. **Device and visitor information**: basic details about the device, client, browser, operating system, and Visitor ID
2. **Location**: includes the IP address and a visual map of the approximate location
3. **Suspect Score**: displays the score and indicates if it is considered low, medium, or high compared to recent traffic
4. **Smart Signal details**: details for all detected Smart Signals, including velocity signals
5. **JSON view**: explore the entire event by looking through the JSON payload
6. **Visitor history**: allows you to see all events detected from that single Visitor ID, which is a convenient way to find recurring patterns or similar events
## Smart Signals Page
The Smart Signals page focuses on providing statistics for [**Smart Signals**](), which are identifiers that give you actionable device intelligence for browsers and devices interacting with your application.
You can access the Smart Signals page by visiting **Dashboard** > [**Smart Signals**](https://dashboard.fingerprint.com/smart-signals).
On the page you can find:
1. **Device and visitor information**: basic details about the device, client, browser, operating system, and Visitor ID
2. **Location**: includes the IP address and a visual map of the approximate location
3. **Suspect Score**: displays the score and indicates if it is considered low, medium, or high compared to recent traffic
4. **Smart Signal details**: details for all detected Smart Signals, including velocity signals
5. **JSON view**: explore the entire event by looking through the JSON payload
6. **Visitor history**: allows you to see all events detected from that single Visitor ID, which is a convenient way to find recurring patterns or similar events
## Smart Signals Page
The Smart Signals page focuses on providing statistics for [**Smart Signals**](), which are identifiers that give you actionable device intelligence for browsers and devices interacting with your application.
You can access the Smart Signals page by visiting **Dashboard** > [**Smart Signals**](https://dashboard.fingerprint.com/smart-signals).
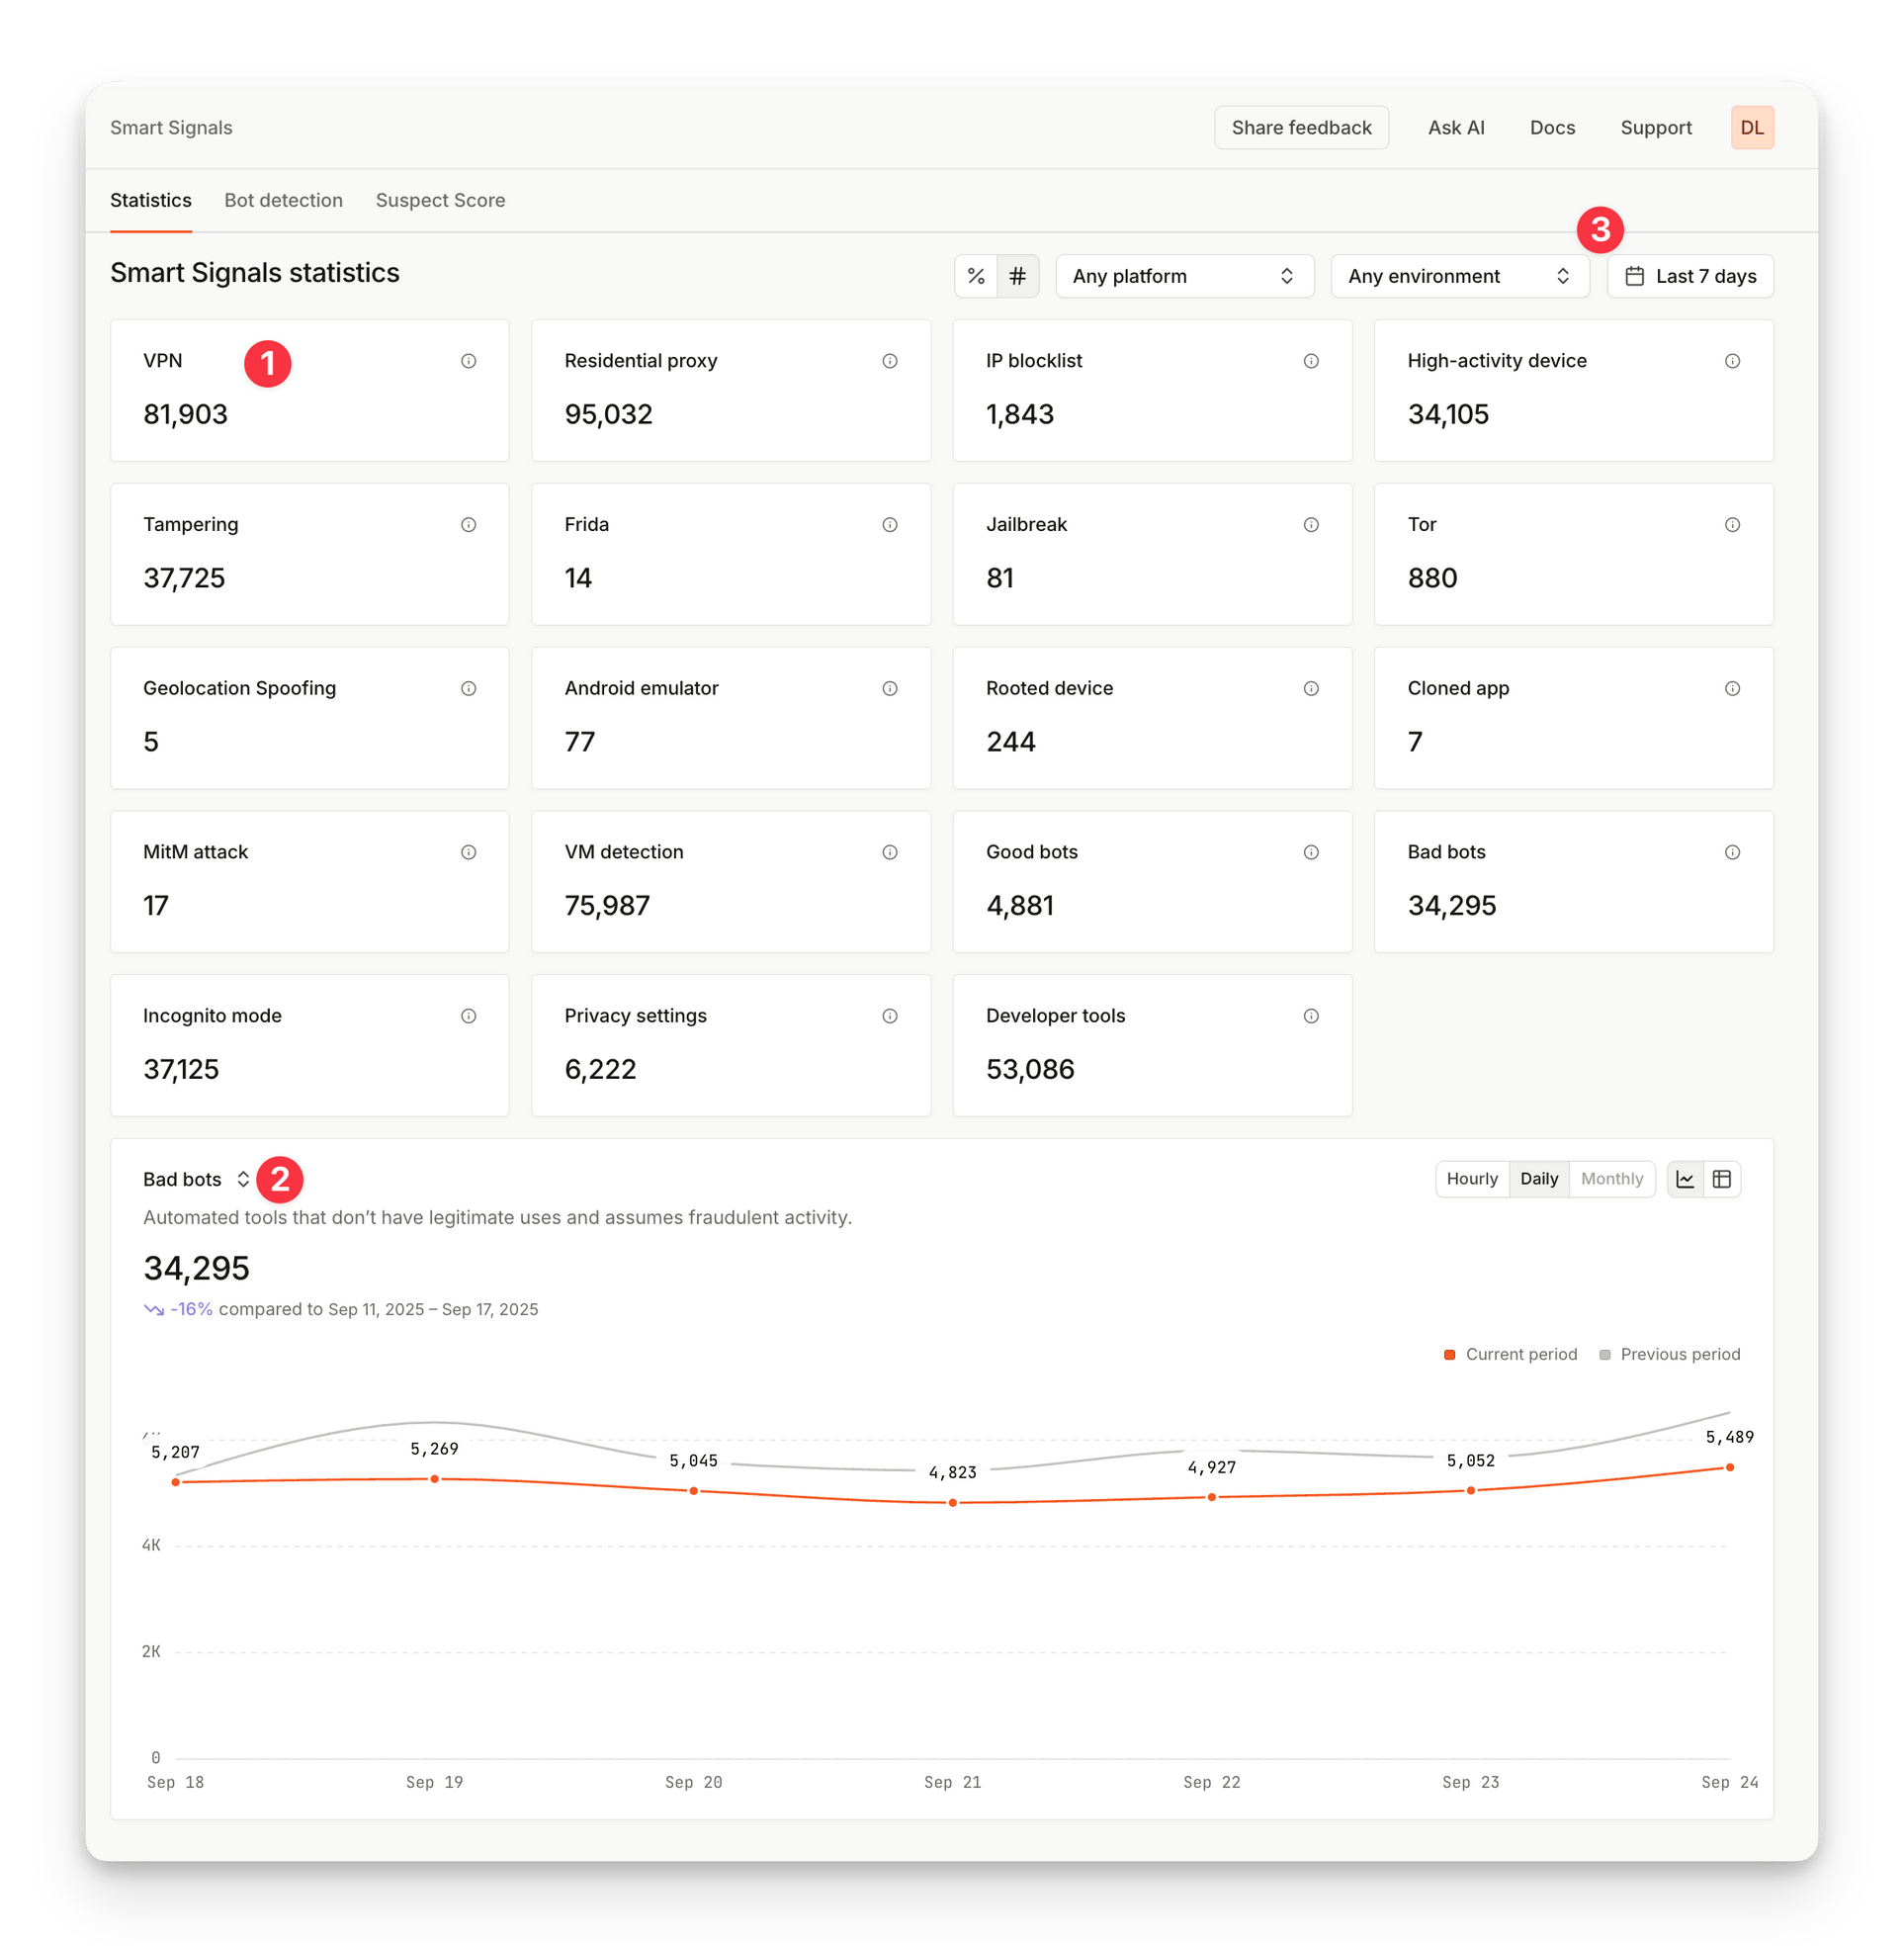 The page features a **list of Smart Signals** (1) and the number of events where each signal was detected for the selected time period.
On the **timeline chart** (2), you can plot the selected signal over time, allowing you to compare the trend with previous period.
This page also includes a date range filter, and an environment filter (3).
**Bot Detection**
By visiting the Bot Detection tab, you can gather more detailed information about detected bots - see the numbers of detected bad or good bots, their trends on the timeline chart, and inspect event details.
Learn more about [bot detection](/docs/bot-detection/overview).
## CSV export
On the Identification page, you can **export** identification events into a **CSV file** for use in your own analysis, or integration with external fraud prevention systems.
To get CSV export of your data, visit **Dashboard** > [**Identification**](https://dashboard.fingerprint.com/events), and click on **Export** (1).
The page features a **list of Smart Signals** (1) and the number of events where each signal was detected for the selected time period.
On the **timeline chart** (2), you can plot the selected signal over time, allowing you to compare the trend with previous period.
This page also includes a date range filter, and an environment filter (3).
**Bot Detection**
By visiting the Bot Detection tab, you can gather more detailed information about detected bots - see the numbers of detected bad or good bots, their trends on the timeline chart, and inspect event details.
Learn more about [bot detection](/docs/bot-detection/overview).
## CSV export
On the Identification page, you can **export** identification events into a **CSV file** for use in your own analysis, or integration with external fraud prevention systems.
To get CSV export of your data, visit **Dashboard** > [**Identification**](https://dashboard.fingerprint.com/events), and click on **Export** (1).
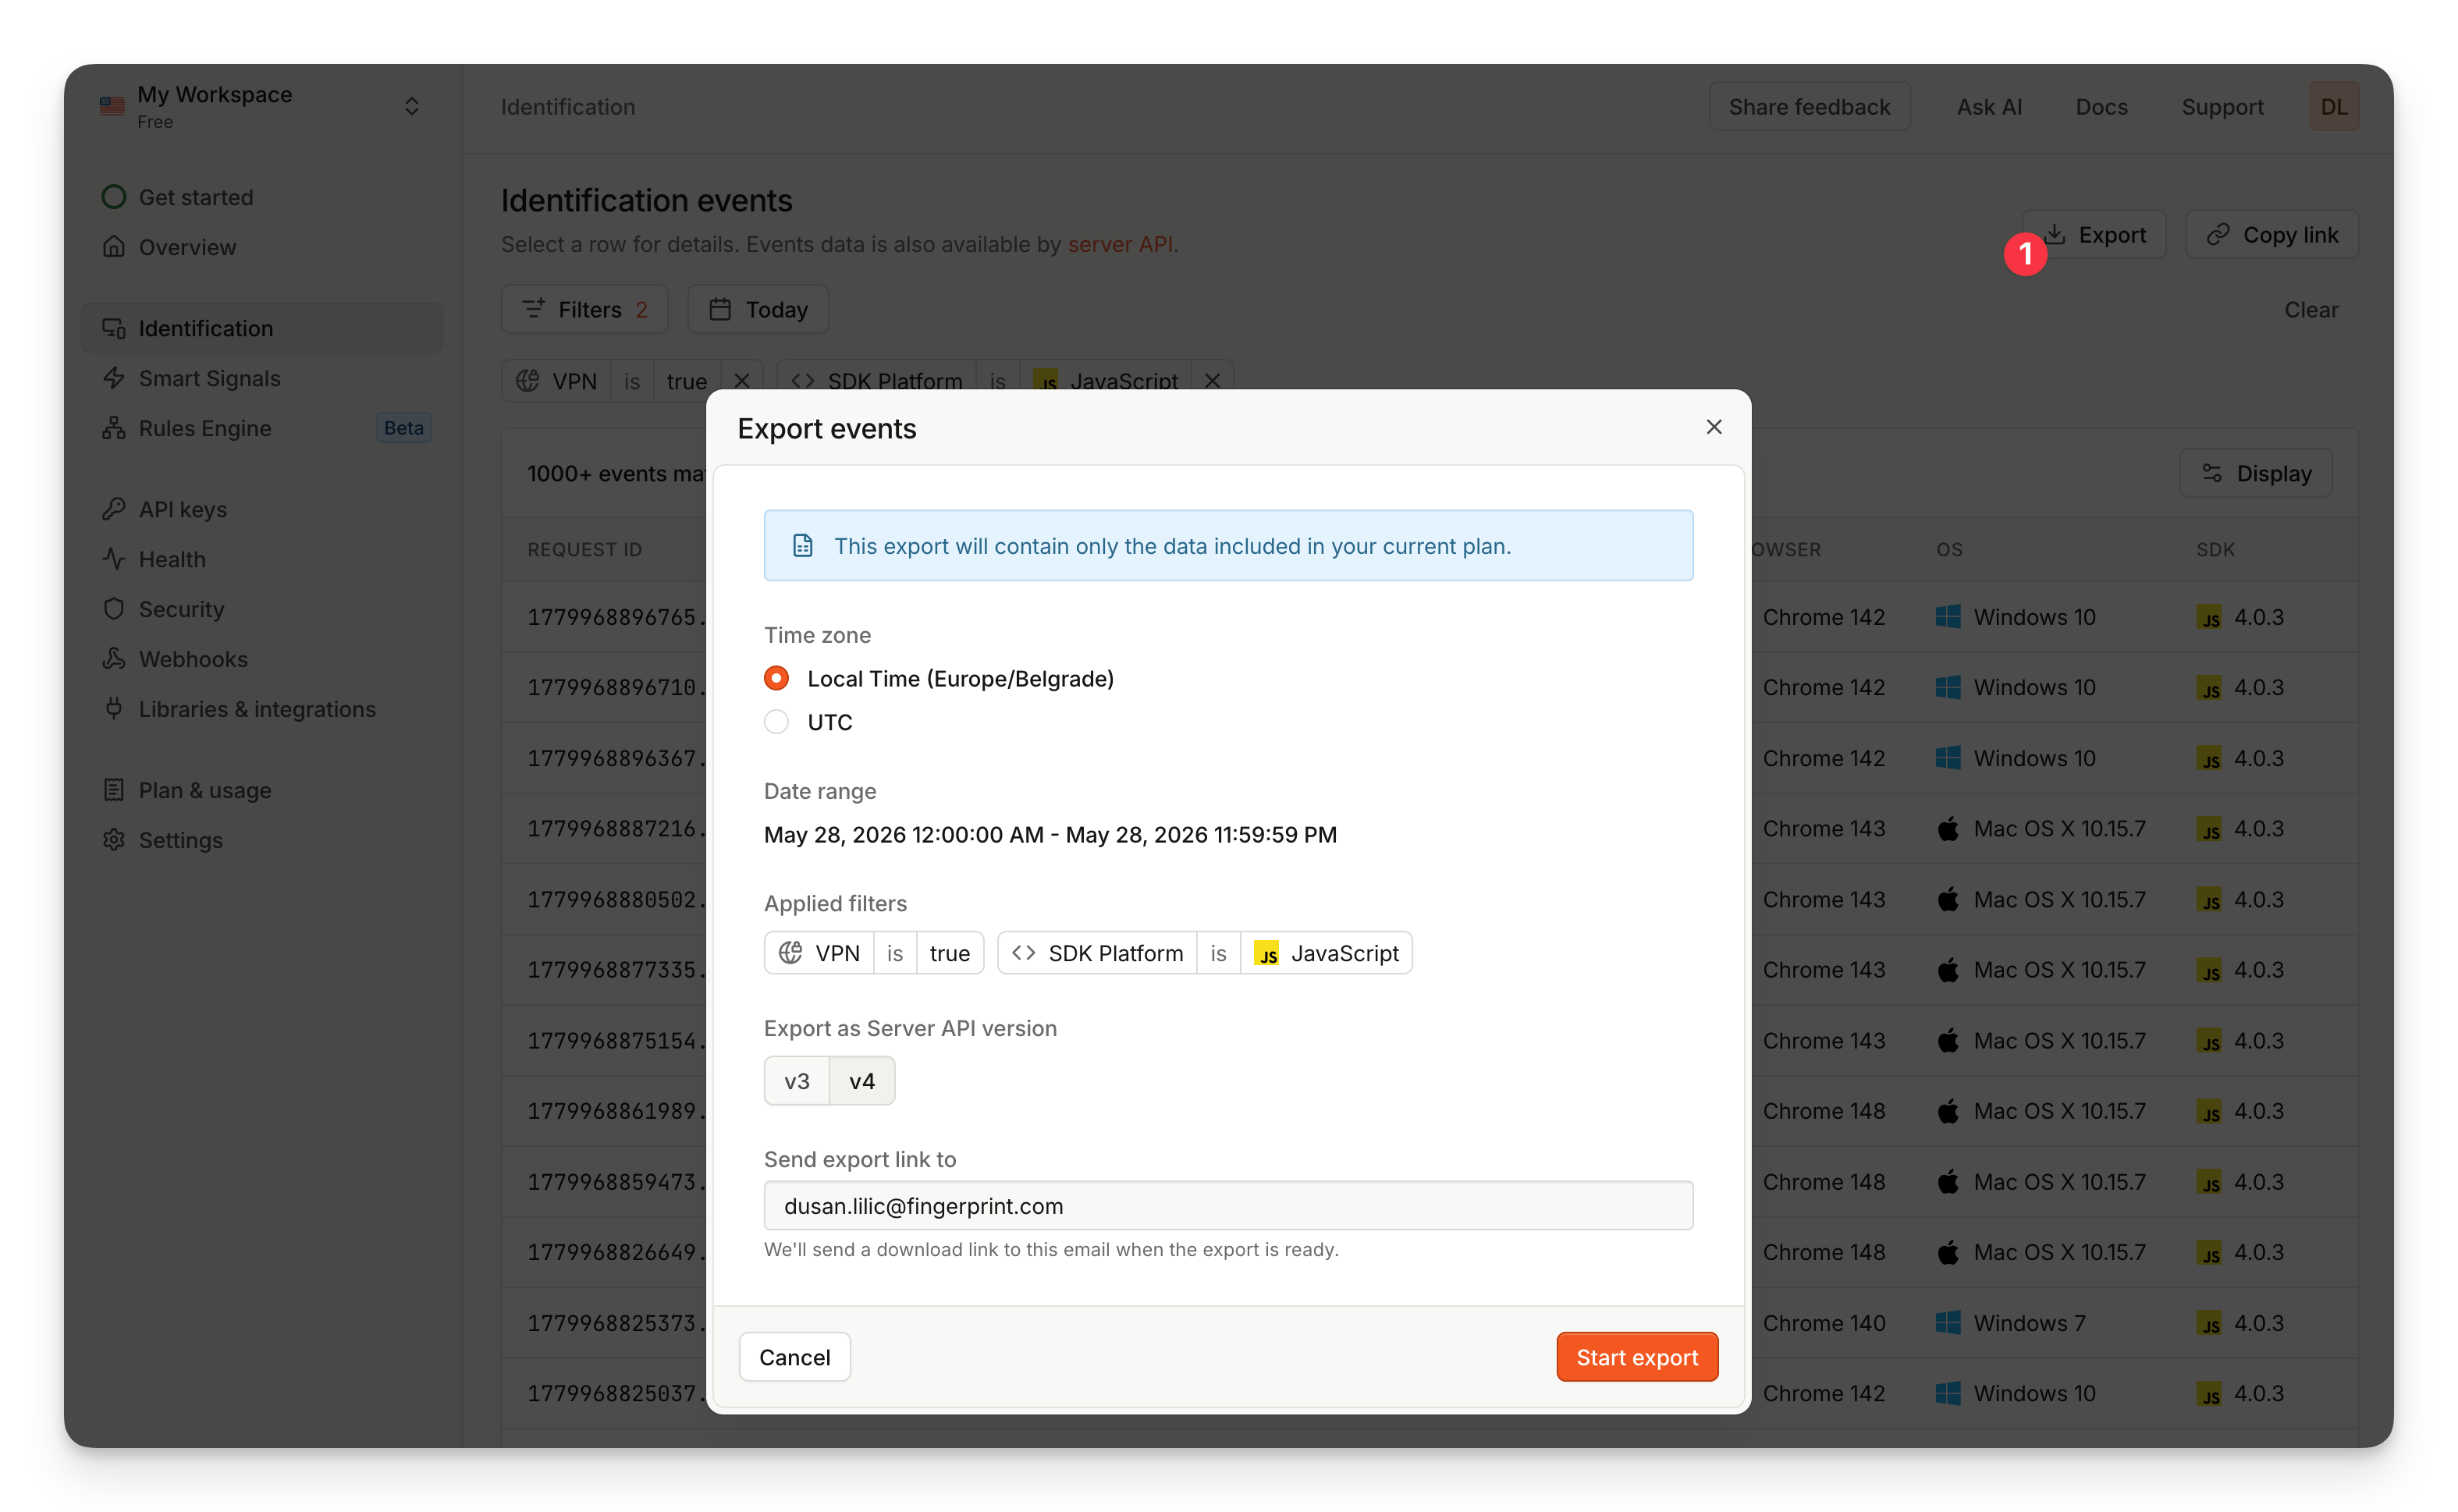 You can filter up to 3 months of data, and any applied filters will also apply on the CSV file. The data provided in the CSV matches the data from the [Server API payload](/reference/server-api-get-event), and available columns are determined by your billing plan.
* event\_id
* timestamp
* replayed
* identification.visitor\_id
* identification.visitor\_found
* identification.confidence.score
* identification.confidence.version
* identification.first\_seen\_at
* identification.last\_seen\_at
* environment\_id
* sdk.platform
* sdk.version
* linked\_id
* tags
* url
* ip\_address
* user\_agent
* client\_referrer
* browser\_details.browser\_name
* browser\_details.browser\_major\_version
* browser\_details.browser\_full\_version
* browser\_details.os
* browser\_details.os\_version
* browser\_details.device
* bot
* developer\_tools
* ip\_blocklist.email\_spam
* ip\_blocklist.attack\_source
* ip\_blocklist.tor\_node
* ip\_info.address
* ip\_info.geolocation.accuracy\_radius
* ip\_info.geolocation.latitude
* ip\_info.geolocation.longitude
* ip\_info.geolocation.postal\_code
* ip\_info.geolocation.timezone
* ip\_info.geolocation.city\_name
* ip\_info.geolocation.country\_code
* ip\_info.geolocation.country\_name
* ip\_info.geolocation.continent\_code
* ip\_info.geolocation.continent\_name
* ip\_info.geolocation.subdivisions.0.iso\_code
* ip\_info.geolocation.subdivisions.0.name
* ip\_info.asn
* ip\_info.asn\_name
* ip\_info.asn\_network
* ip\_info.asn\_type
* ip\_info.datacenter\_result
* ip\_info.datacenter\_name
* proximity\_id
* proximity\_confidence
* proximity\_precision\_radius
* proxy
* proxy\_confidence
* proxy\_details.proxy\_type
* incognito
* privacy\_settings
* suspect\_score
* tampering
* tampering\_details.anomaly\_score
* tampering\_details.anti\_detect\_browser
* velocity.distinct\_ip.5\_minutes
* velocity.distinct\_ip.1\_hour
* velocity.distinct\_ip.24\_hours
* velocity.distinct\_country.5\_minutes
* velocity.distinct\_country.1\_hour
* velocity.distinct\_country.24\_hours
* velocity.events.5\_minutes
* velocity.events.1\_hour
* velocity.events.24\_hours
* velocity.ip\_events.5\_minutes
* velocity.ip\_events.1\_hour
* velocity.ip\_events.24\_hours
* velocity.distinct\_linked\_id.5\_minutes
* velocity.distinct\_linked\_id.1\_hour
* velocity.distinct\_linked\_id.24\_hours
* velocity.distinct\_ip\_by\_linked\_id.5\_minutes
* velocity.distinct\_ip\_by\_linked\_id.1\_hour
* velocity.distinct\_ip\_by\_linked\_id.24\_hours
* velocity.distinct\_visitor\_id\_by\_linked\_id.5\_minutes
* velocity.distinct\_visitor\_id\_by\_linked\_id.1\_hour
* velocity.distinct\_visitor\_id\_by\_linked\_id.24\_hours
* virtual\_machine
* vpn
* vpn\_confidence
* vpn\_origin\_timezone
* vpn\_origin\_country
* vpn\_methods.timezone\_mismatch
* vpn\_methods.public\_vpn
* vpn\_methods.auxiliary\_mobile
* vpn\_methods.os\_mismatch
* vpn\_methods.relay
* high\_activity\_device
* root\_apps
* emulator
* cloned\_app
* factory\_reset.time
* factory\_reset.timestamp
* jailbroken
* frida
* location\_spoofing
* mitm\_attack
* remote\_control
* simulator
* raw\_device\_attributes
***
[Using the Dashboard](/docs/using-the-dashboard)
You can filter up to 3 months of data, and any applied filters will also apply on the CSV file. The data provided in the CSV matches the data from the [Server API payload](/reference/server-api-get-event), and available columns are determined by your billing plan.
* event\_id
* timestamp
* replayed
* identification.visitor\_id
* identification.visitor\_found
* identification.confidence.score
* identification.confidence.version
* identification.first\_seen\_at
* identification.last\_seen\_at
* environment\_id
* sdk.platform
* sdk.version
* linked\_id
* tags
* url
* ip\_address
* user\_agent
* client\_referrer
* browser\_details.browser\_name
* browser\_details.browser\_major\_version
* browser\_details.browser\_full\_version
* browser\_details.os
* browser\_details.os\_version
* browser\_details.device
* bot
* developer\_tools
* ip\_blocklist.email\_spam
* ip\_blocklist.attack\_source
* ip\_blocklist.tor\_node
* ip\_info.address
* ip\_info.geolocation.accuracy\_radius
* ip\_info.geolocation.latitude
* ip\_info.geolocation.longitude
* ip\_info.geolocation.postal\_code
* ip\_info.geolocation.timezone
* ip\_info.geolocation.city\_name
* ip\_info.geolocation.country\_code
* ip\_info.geolocation.country\_name
* ip\_info.geolocation.continent\_code
* ip\_info.geolocation.continent\_name
* ip\_info.geolocation.subdivisions.0.iso\_code
* ip\_info.geolocation.subdivisions.0.name
* ip\_info.asn
* ip\_info.asn\_name
* ip\_info.asn\_network
* ip\_info.asn\_type
* ip\_info.datacenter\_result
* ip\_info.datacenter\_name
* proximity\_id
* proximity\_confidence
* proximity\_precision\_radius
* proxy
* proxy\_confidence
* proxy\_details.proxy\_type
* incognito
* privacy\_settings
* suspect\_score
* tampering
* tampering\_details.anomaly\_score
* tampering\_details.anti\_detect\_browser
* velocity.distinct\_ip.5\_minutes
* velocity.distinct\_ip.1\_hour
* velocity.distinct\_ip.24\_hours
* velocity.distinct\_country.5\_minutes
* velocity.distinct\_country.1\_hour
* velocity.distinct\_country.24\_hours
* velocity.events.5\_minutes
* velocity.events.1\_hour
* velocity.events.24\_hours
* velocity.ip\_events.5\_minutes
* velocity.ip\_events.1\_hour
* velocity.ip\_events.24\_hours
* velocity.distinct\_linked\_id.5\_minutes
* velocity.distinct\_linked\_id.1\_hour
* velocity.distinct\_linked\_id.24\_hours
* velocity.distinct\_ip\_by\_linked\_id.5\_minutes
* velocity.distinct\_ip\_by\_linked\_id.1\_hour
* velocity.distinct\_ip\_by\_linked\_id.24\_hours
* velocity.distinct\_visitor\_id\_by\_linked\_id.5\_minutes
* velocity.distinct\_visitor\_id\_by\_linked\_id.1\_hour
* velocity.distinct\_visitor\_id\_by\_linked\_id.24\_hours
* virtual\_machine
* vpn
* vpn\_confidence
* vpn\_origin\_timezone
* vpn\_origin\_country
* vpn\_methods.timezone\_mismatch
* vpn\_methods.public\_vpn
* vpn\_methods.auxiliary\_mobile
* vpn\_methods.os\_mismatch
* vpn\_methods.relay
* high\_activity\_device
* root\_apps
* emulator
* cloned\_app
* factory\_reset.time
* factory\_reset.timestamp
* jailbroken
* frida
* location\_spoofing
* mitm\_attack
* remote\_control
* simulator
* raw\_device\_attributes
***
[Using the Dashboard](/docs/using-the-dashboard)